Adding a Chart
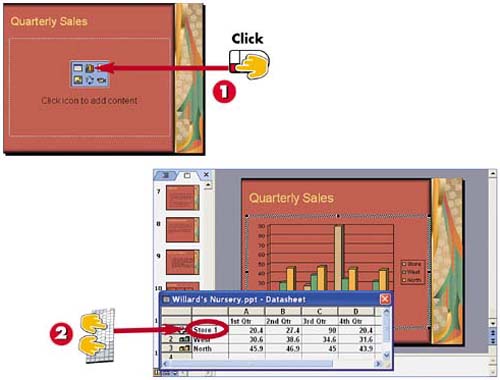

Click the Insert Chart icon in the placeholder slide object.

A datasheet appears, along with a default chart. To enter chart data, click in the first datasheet cell and type the data, and press Enter. PowerPoint moves the cursor to the next cell in the chart.
INTRODUCTION
You can create your own charts in PowerPoint using the charting feature. Several slide layouts include placeholder slide objects for creating charts. When activated, the chart feature opens a default column chart along with a datasheet. The datasheet resembles worksheets found in spreadsheet programs such as Microsoft Excel. You can enter your own chart information into the datasheet using rows and columns.
TIP
Adding a Chart Without a Chart Placeholder
You need not use a layout that already contains a chart placeholder; you can add a new chart to any slide. To do so, click the Insert Chart button on the Standard toolbar.
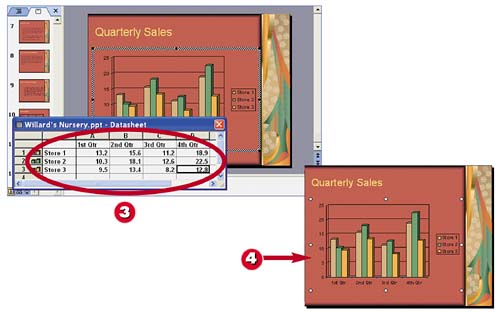

Continue adding your data to the cells. (Press Tab to move from cell to cell, or the arrow keys to move around the cells.) When you finish, click anywhere outside the datasheet.

PowerPoint returns you to Normal view, and the chart appears on the slide.
TIPEnlarging the Datasheet If you require more room in the datasheet for values, you can click and drag any corner of the datasheet to increase its size. |
TIPResizing the Chart on the Slide Click the chart to select it, and PowerPoint surrounds it with selection handles. You can then click and drag a handle to resize the chart. Charts act like any other slide object, which means you can resize them. |
TIPDeleting a Chart To remove a chart object, first select the chart, and then press the Delete key on your keyboard. |


