Adding a Microsoft Excel Chart
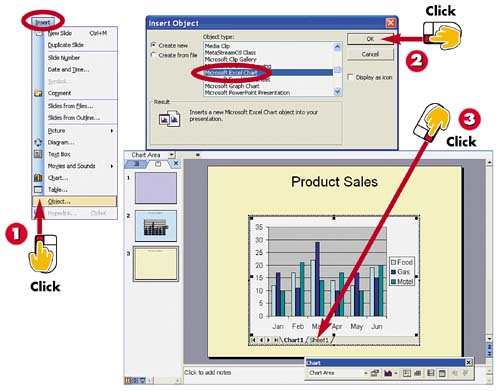

Open the Insert menu and choose Object.

The Insert Object dialog box opens. Click Excel Chart and click OK.

PowerPoint displays a worksheet, a chart and the Chart toolbar. Click the Sheet1 tab.
INTRODUCTION
If you are an experienced Microsoft Excel user, you can add a new Excel chart and worksheet to your slide and enter your own chart data. When you activate this feature, a single worksheet and a chart sheet display on your slide. The toolbars also include Excel tools, such as the AutoSum and Paste Function tools, which you can use to create formulas and format the worksheet cells.
TIP
Zooming
You might need to zoom your view of the chart to better see the data you want to enter. See Part 1 to learn more about zooming in or out to see slides.
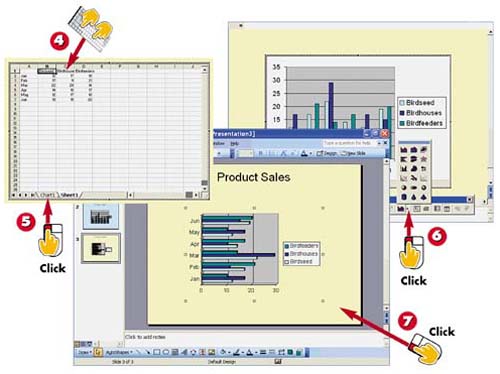

Enter your chart data.

Click the Chart1 tab to view the data as a chart.

To change the chart type, click the Chart Type button in the Chart toolbar and select a type from the options that appear.

The new chart type is applied. Click anywhere outside the chart to deselect the chart.
TIPEditing a Chart To return to the worksheet you used to create the chart, double-click on the chart. |
TIPAdding a Worksheet To add a plain worksheet?but no Excel chart?to your slide, open the Insert menu and choose Object to open the Insert Object dialog box. Select Microsoft Excel Worksheet and click OK. A single worksheet is added. |
TIPAdding an Existing Chart Use the Copy and Paste commands to add an existing Excel chart to a slide. Open Excel, select the chart, and click the Copy button. Return to PowerPoint, click where you want the chart to go, and click the Paste button. |


