Changing the Data Plot
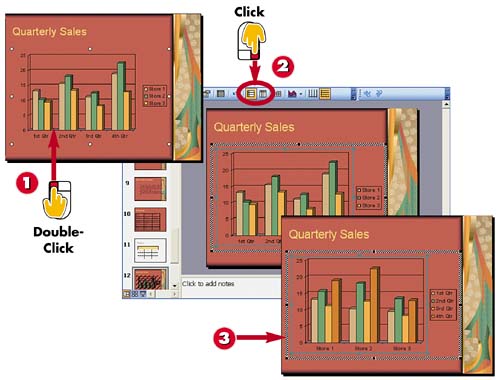

Double-click the chart.

Click the By Row or By Column button in the Standard toolbar.

PowerPoint changes the data plot.
INTRODUCTIONYou can change the way in which your data is presented in a chart by changing the data plot. Data is plotted based on how you enter it into the datasheet, by row or by column. However, you can switch it around to change the data plot. |
TIPDisplaying the Datasheet Click the View Datasheet button on the Standard toolbar to hide or display the datasheet. For example, you might hide the datasheet to better see the chart area. |


