Using Trendlines
Spotting trends is a major use of charts and data. Trendlines extend your actual data forward to predict where future data points may fall. You can also test your data and analysis by extending the data backward and comparing it against actual, older figures.
Trendlines can be used in various chart types: unstacked area, bar, column, line, stock, XY (scatter), and bubble charts. However, you cannot add trendlines to a 3D, stacked, radar, pie, or doughnut chart. If you have trendlines in place and you convert your chart to one that does not support trendlines, the trendlines disappear.
It's easy to add a trendline to your chart. Choose Chart, Add Trendlines. (If Add Trendlines is not active, your chart type doesn't support this option.) The Add Trendline dialog box opens, as shown in Figure 15.22.
Figure 15.22. Choose a trend analysis from six different formulas.
On the Type tab, you can choose from six Trend/Regression formulas: Linear, Logarithmic, Polynomial, Power, Exponential, and Moving Average. After you've chosen a formula type for your trendline, click the Options tab of the Add Trendline dialog box. Here, you can give your trendline a custom name and set the number of periods your trendline is to forecast both forward and backward.
Table 15.2 lists the trendline options and their key uses.
Chart Element | Use When the Pattern in Your Data Points Indicates… |
|---|---|
Linear | Growth or decline at an approximately steady rate. |
Logarithmic | Rapid growth or decline followed by a leveling out. |
Polynomial | Ongoing fluctuations in data (hills and valleys). |
Power | Increase or decrease at a roughly constant rate (for example, acceleration or deceleration). Cannot be used if any of your data points is zero or negative. |
Exponential | Increase or decrease at accelerating or decelerating rates. Cannot be used if any of your data points is zero or negative. |
Moving Average | Smoothes out temporary fluctuations which might otherwise obscure a pattern of data. |
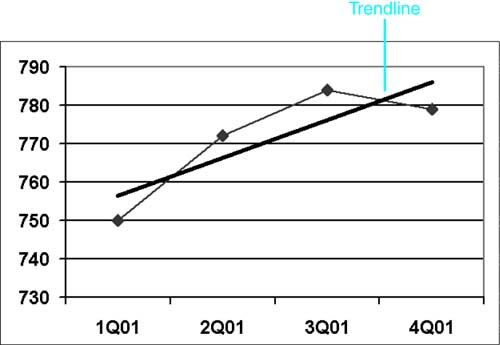
After you set these options, your chart will contain a trendline similar to the one in Figure 15.23. You can change the color, style, and weight of the trendline (and reset any of the previously chosen options, as well) by selecting the line and clicking the Format button on Graph's Standard toolbar.
Figure 15.23. Trendlines predict future developments based on current data.