Using the Sys.Debug Class
Using the Sys.Debug Class
The ASP.NET AJAX Library includes a helper class named Sys.Debug that can be used on the client side to write to trace logs, perform assert statements, and trigger a debug session in Visual Studio .NET. Knowing how to use the Sys.Debug class can help simplify the process of ensuring that client-side functionality is performing properly and allow you to more easily view data passed from function to function in an application.
The Sys.Debug class is included in the release and debug versions of the MicrosoftAjax.js client- script file shipped with ASP.NET AJAX. It defines several different functions that can be called to perform assertions, tracing, and debugging. The following table shows the different functions available on the Sys.Debug class.
|
Function Name |
Description |
|---|---|
|
assert(condition,message,displayCaller) |
Asserts that the condition parameter is true. If the condition being tested is false, a message box will be used to display the message parameter value. If the displayCaller parameter is true, the method also displays information about the caller. |
|
clearTrace() |
Erases statements output from tracing operations. |
|
fail(message) |
Causes the program to stop execution and break into the debugger. The message parameter can be used to provide a reason for the failure. |
|
trace(message) |
Writes the message parameter to the trace output. |
|
traceDump(object,name) |
Outputs an object’s data in a readable format. The name parameter can be used to provide a label for the trace dump. Any subobjects within the object being dumped will be written out by default. |
Performing Trace Operations
If you’ve used ASP.NET’s built-in trace functionality, you’ll feel right at home with the Sys.Debug class’s tracing capabilities. It can be used to write client-side trace messages that can be used to track the flow of an ASP.NET AJAX application. An example of using the Sys.Debug class to write to the client-side trace output is shown in Listing 9-7. Figure 9-1 shows what the trace log looks like when rendered to the page.
var album = new Wrox.ASPAJAX.Samples.Album();
album.set_title("Sam's
album.set_artist("The Killers");

Sys.Debug.trace("Set album title and artist properties");

$get("lblTitle").innerHTML = album.get_title();
$get("lblArtist").innerHTML = album.get_artist();

Sys.Debug.trace("Album properties written out to page");
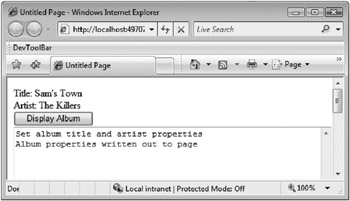
Figure 9-1
Adding Sys.Debug.trace statements into existing JavaScript code doesn’t automatically cause the trace messages to be written to the page. In fact, at first glance you’ll wonder if any type of tracing operation was performed at all when viewing a page that contains one or more trace statements. To view trace output in the page, you’ll need to add a TextArea tag into the page and give it an id of TraceConsole. The trace function looks for the TraceConsole ID defined on a TextArea tag as it writes out trace messages. Listing 9-8 shows code from the ASP.NET AJAX Library that handles writing trace statements.
function Sys$_Debug$_appendTrace(text) {
    var traceElement = Sys.UI.DomElement.
    if (traceElement && (traceElement.tagName.toUpperCase() ===
        traceElement.value += text + '\n';
    }
}
Here’s an example of defining a TextArea tag to capture and display trace information:
<textarea id="TraceConsole" rows="25" cols="60"></textarea>
<textareaid="TraceConsole"rows="25"cols="60"></textarea>
You may look at this and wonder if there may be a better way to view trace output. After all, once an application is ready to move to production, it would be time consuming (and error prone) to locate all of the pages that have TextArea tags used to display trace statements and then remove them. Fortunately, Visual Studio .NET can also be used to view trace output using the Output window, as shown in Figure 9-2. This won’t require you to use a TraceConsole TextArea on your page.
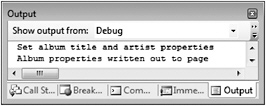
Figure 9-2
Additional information about using Visual Studio .NET to debug ASP.NET AJAX applications and view other useful information is covered later in this chapter.
In addition to allowing custom trace data to be written to the page, the Sys.Debug class’s traceDump function can be used to convert JSON objects into a more readable format to easily inspect the data within an object. This will show all the properties of the object without requiring you to specify them individually. The traceDump function accepts the object to display as a parameter along with a label to associate with the trace dump to make it easier to identify. Listing 9-9 shows an example of using the traceDump function to write the values contained within an Album object. Figure 9-3 shows the output.
var album = new Wrox.ASPAJAX.Samples.Album();
album.set_title("Sam's Town");
album.set_artist("The Killers");
Sys.Debug.trace("Set album title and artist properties");

$get("lblTitle").innerHTML = album.get_title();
$get("lblArtist").innerHTML = album.get_artist();

Sys.Debug.trace("Album properties written out to page");

//Dump the album object to the trace output console
Sys.Debug.traceDump(album,"Album Details:");
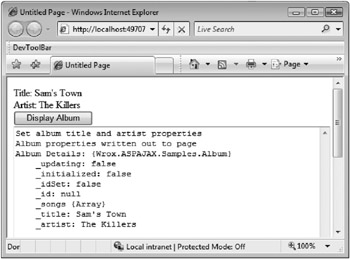
Figure 9-3
The Sys.Debug.traceDump function also handles writing nested subobjects automatically. For example, Listing 9-10 shows how an Album object containing an array of nested Song objects is written to the page. Looking at the output generated from this call (see Figure 9-4), you’ll see that it is fairly verbose. In cases where you would like to clear the current trace log so that other trace statements are easier to find in the trace console area, you can use the Sys.Debug.clearTrace function.
var album = new Wrox.ASPAJAX.Samples.Album();
album.set_title("Sam's Town");
album.set_artist("The Killers");

//Add Song objects into Album's
album.addSong(new Wrox.ASPAJAX.Samples.Song(3,"When you were young"));
album.addSong(new Wrox.ASPAJAX.Samples.Song(7,"Uncle Johnny"));

$get("lblTitle").innerHTML = album.get_title();
$get("lblArtist").innerHTML = album.get_artist();
Sys.Debug.trace("Album properties written out to page");

//Write out Album and nested Song objects
Sys.Debug.traceDump(album,"Album and Song Details:");
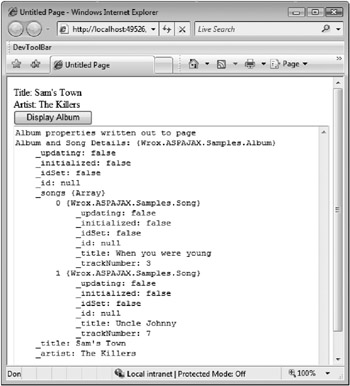
Figure 9-4
Performing Assert Operations
The Sys.Debug class can also be used to assert that a condition is true in order to check that objects are available to call or that an action has occurred as expected. In cases where the condition fails, a message box will be displayed. The assert function accepts three parameters, including the condition to check, the message to display if the assertion fails, and whether or not the caller’s information should be displayed.
Using the assert function makes it straightforward to test a specific condition within JavaScript code and alert you when it doesn’t evaluate to true. It’s a nice feature, as it doesn’t require you to add conditional statements (if or switch statements) into an application.
An example of using the Sys.Debug.assert function to check that an Album contains songs is shown in Listing 9-11, while an example of the output is shown in Figure 9-5.
var album = new Wrox.ASPAJAX.Samples.Album();
album.set_title("Sam's Town");
album.set_artist("The Killers");

//Assert that the songs.length condition is true or not
Sys.Debug.assert(album.get_songs.length > 0,"No songs for album");
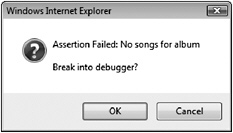
Figure 9-5
You can also obtain additional details about the condition being evaluated by passing a third Boolean parameter named displayCaller to the assert function as shown next:
debug.assert(album.get_songs.length > 0,"No songs for album",true);
Figure 9-6 shows what the assert message box looks like when the displayCaller parameter is set to true.
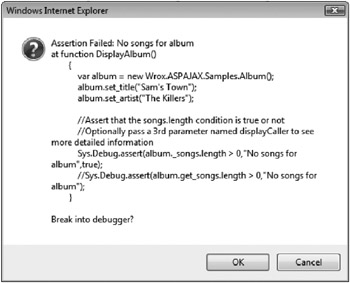
Figure 9-6
When an assertion fails, you are given the option to break into a debugger to more thoroughly evaluate the condition and step through the code. A debug session can also be started by calling the Sys.Debug.fail function within JavaScript code. For debugging to start and work properly, however, specific settings within Internet Explorer must be enabled. In the next section, you’ll see how to enable Internet Explorer for debugging and work with Visual Studio .NET and Microsoft’s Script Debugger.


