Debugging Overview
Debugging Overview
Debugging techniques vary between project types. For example, the strategy for debugging a Microsoft Windows application is different from debugging a class library. This section provides an overview of debugging strategies for basic project types.
Debugging Windows Forms Projects
Of the project types, managing a debugging session for a Windows Forms project is probably the easiest. Initiate a debugging session to begin debugging a Windows Forms application.
Start a debugging session of a Windows Forms project with a start execution action, such as the Start Debugging menu command. When the execution starts, the Visual Studio debugger is attached to the application.
Set breakpoints before or during the debugging session. Windows Forms applications are event driven, and breakpoints can be placed in event handlers. Breakpoints can also be added to functions called from event handlers. When the breakpoint is hit, the debugging session is transferred to break mode. To run between breakpoints, use the Start Debugging menu command.
Attaching to a Running Process
You can attach the debugger to processes running outside of Visual Studio. At that time, a debug session is initiated. There are several reasons to attach to a process:
-
When a problem occurs in an application, you can immediately debug the situation. Attach the debugger and diagnose the problem.
-
You can debug a class library project in the context of a running process.
-
You can debug a production application. If you attach to an application that is not a debug build, an error message box is displayed. You can then proceed into a debugging session. However, source code, symbols, and other ingredients of a normal debugging session might not be available. Care must be taken when debugging a production application. Some actions can interfere with the normal execution of the program. For example, breakpoints can interrupt execution of the application and strand users.
Open the Attach To Process window to attach to a process. (From the Debug menu, choose the Attach To Process menu command.) Figure 12-1 shows the Attach To Process window. The Debug menu is not available when no solution is open. In that circumstance, choose the Attach To Process menu command from the Tools menu.

Figure 12-1: Attach To Process window
A list of processes is presented in the Attach To Process window. To attach to a specific process, select a process from the Available Processes list and then click the Attach button. If not a debug build, an error message box is displayed. The debugger can be attached to multiple processes. All the attached processes are dimmed in the process list. However, you can actively debug only a single process, which defaults to the last process attached. You can change a current process by using the Debug Location toolbar and the Process drop-down list, which is shown in Figure 12-2. You can also select the Debug Location toolbar from the Toolbars submenu on the View menu.
Figure 12-2: Debug Location toolbar
The Attach To Process window has several options. Transport is the transport used to connect to a target device or remote machine. Default connects to a local machine or remote machine using the Microsoft Visual Studio Remote Debugging Monitor (msvsmon.exe). The Qualifier window is the name of the target machine. The Attach To choice selects the target type as managed, native, script, or T-SQL. The default is managed. The Show Processes For All Users option lists processes from all users of the current logon session. For Terminal Service clients remotely connected to a machine, Show Processes In All Sessions displays the processes of the remote machine session. The process list is not static. As new processes start up and existing processes finish, the list of running processes changes. The Refresh button updates the list box to reflect any changes in the process list.
After attaching to an application, interrupt the application with a breakpoint. You can then use debugging techniques and the various debugging windows to debug the application. To set a breakpoint, open the source code of the application and insert a breakpoint. When execution hits the breakpoint, the application is interrupted. Alternatively, use the BreakAll menu command on the Debug menu.
Terminate the debugging session to detach the debugger from the running process. For example, the Stop Debugging menu command on the Debug menu terminates a debugging session and detaches from a running process. The running process will continue to execute.
Debugging Console Application Projects
Debugging a Console project is similar to debugging a Windows application, with some notable differences:
-
Console applications typically output to the Console window, but debug messages are normally displayed in the Output window. Displaying messages in separate windows has both advantages and disadvantages. Clarity in isolation of debug messages is the primary advantage. Parsing debug and normal messages in separate windows helps track both. Conversely, the advantage of a single window for all output is convenience. The developer need not toggle between the Console and Output windows. With the TraceSource type, you have the option of displaying trace messages in several locations, including the Console window, Output window, or both windows simultaneously.
-
Console applications often require command-line arguments. Open Project properties from the Project menu. From the Debug window, enter the command-line arguments as part of the Startup Options. Be sure to refresh the command-line arguments as needed.
-
In a debugging session, the results of a short running console application are only briefly displayed before the console window is closed. Therefore, the results may be difficult to view. Freeze the window by inserting a Console.ReadLine statement. Alternatively, after debugging the application, execute in release mode to persist the Console window. In that case, Press Any Key To Continue is displayed.
Debugging Class Library Projects
A class library project creates a dynamic-link library (DLL), which does not execute directly. This makes the proposition of debugging more challenging. The DLL must run within the context of another application. The execution of the host application precedes the DLL. The host loads the DLL when needed.
You can specify the host application in the debug settings for the project. In the Debug pane of the Project properties window, select the Start External Program option as the Start action and enter the name of the hosting application. At the start of the debugging session, the specified host is executed and the DLL is loaded as needed. You can then debug the class library project.
If the host application and class library projects are in the same solution, setting the external program is not necessary. Simply set the host application to the startup project. Start a debugging session normally and debug both the host and class library projects.
When the host application is already running, attach the debugger to that process in the Attach To Process window. This process will initiate a debug session in which the class library project can then be debugged.
Debugging Setup
The Visual Studio debugger is fully configurable. Debugging sessions can be tailored to a developer or to the specific requirements of an application. For convenience, debug settings are saved in a configuration. Debug and Release are the default configurations and represent the most commonly used settings. The Debug configuration contains the project options for creating debug builds of an application. The Release configuration contains the options for release builds. Prior to changing project settings, it is good policy to confirm the active configuration. This avoids inadvertently changing the wrong configuration.
Debug and Release Configurations
As mentioned, the default configurations are Debug and Release. There are literally dozens of project options set in the predefined Debug and Release configurations. You can view and set debug configurations from Project properties in Solution Explorer. Open Project properties using the project context menu.
The important settings of the Debug configuration are as follows:
-
The DEBUG and TRACE constants—which control the behavior of the TraceSource, Debug, and Trace types—are defined.
-
The Debug Info option is set to full. This option requests the creation of a symbol file (pdb) whenever a project is built.
-
The output path is bin\debug.
-
The Optimize Code option is set to false, which disables code optimization.
The settings of the Release configuration are as follows:
-
The DEBUG constant is not defined; however, the TRACE constant is defined.
-
The Debug Info option is set to pdb-only.
-
The output path is bin\release.
-
The Optimize Code option is set to true, which enables code optimization.
Configuration Manager
Use the Configuration Manager to view, edit, and create configurations of project settings. To open the Configuration Manager, choose the Configuration Manager menu command from the Build Menu. Figure 12-3 shows the Configuration Manager. The Configuration Manager lists the current configuration of each project in the solution.

Figure 12-3: Configuration Manager
In the Configuration Manager, the Active Solution Configuration drop-down list selects a common configuration for every project. You can also create a new configuration from the drop-down list. In addition, you can rename or remove an existing configuration. The Active Solution Platform drop-down list selects the current platform.
Each row of the Configuration Manager represents a project. The project list has several columns of information:
-
Project This column shows the name of each project.
-
Configuration This column selects the current configuration of each project.
-
Platform This column selects the target platform of each project.
-
Build This column is an option box, which includes or excludes projects in builds of the solution.
Debug Settings
The Visual Studio environment, solution, and project maintain separate debug settings:
-
Debug settings of the Visual Studio environment are set in the Options dialog box. (From the Tools menu, choose the Options menu command.)
-
Debug settings of a project are set in the Project properties dialog box, which is opened by using the Project properties menu command on the Project menu.
-
Debug settings of a solution are set in the Solution properties window. Open this window from the context menu of the solution in Solution Explorer.
Visual Studio Environment Debug Settings
Debug settings for the Visual Studio product affect all projects. You can configure Edit And Continue, just-in-time (JIT) debugging, native debugging options, symbol servers, and general debugging options for the environment.
General window The general debugging options are an assortment of miscellaneous options. Each option can be enabled or disabled. Figure 12-4 shows the General window for setting these options.

Figure 12-4: The General window for setting general debugging options
Each option is described in Table 12-2.
|
Option |
Description |
Default |
|---|---|---|
|
Ask Before Deleting All Breakpoints |
This option requests confirmation with the Delete All Breakpoints command. |
Enabled |
|
Break All Processes When One Process Breaks |
This option interrupts all processes being debugged when a break occurs. |
Enabled |
|
Break When Exceptions Cross AppDomain Or Managed/Native Boundaries (Managed Only) |
This option asks the Common Language Runtime (CLR) to catch exceptions that cross an application domain or cross between managed and native code. |
Disabled |
|
Enable Address-Level Debugging |
This option allows certain operations at the address level, such as setting breakpoints on instruction addresses. |
Enabled |
|
Show Disassembly If Source Is Not Available |
This option requests that the disassembly window be displayed when user source code is not available. |
Disabled |
|
Enable Breakpoint Filters |
This option lets developers set filters on breakpoints, which can limit the scope of a breakpoint to a thread, process, or machine. |
Enabled |
|
Enable The Exception Assistant |
This option automatically displays the Exception Assistant when an exception is raised while debugging. |
Enabled |
|
Unwind The Call Stack On Unhandled Exceptions |
This option allows the user to unwind the call stack on a first chance exception, in which code changes can be made including repairing the source of the exception. |
Enabled |
|
Enable Just My Code (Managed Only) |
This option allows the debugger to step into user code. Other code, such as system code, is skipped. |
Enabled |
|
Warn If No User Code On Launch |
This option displays a warning when debugging is initiated if no user code is available. |
Enabled |
|
Enable Property Evaluation And Other Implicit Function Calls |
This option evaluates the result of properties and other implicit function calls in Watch and Variables windows. |
Enabled |
|
Call ToString() On Objects In Variables Windows (C# Only) |
This option calls ToString implicitly on objects displayed in variables windows. |
Enabled |
|
Enable Source Server Support |
This option requests that Visual Studio get source course from the source code server (srcsrv.dll). |
Disabled |
|
Print Source Server Diagnostics Messages To The Output Window |
This option displays messages from the source server in the Output window. |
Disabled |
|
Highlight Entire Source Line For Breakpoints And Current Statement |
This option highlights an entire line of source code to emphasize the current breakpoint or statement. |
Disabled |
|
Require Source Files To Exactly Match The Original Version |
This option asks the Visual Studio debugger to verify that the current source file matches the version built with the application. |
Enabled |
|
Redirect All Output Window Text To The Immediate Window |
This option redirects messages from the Output window to the Immediate window. |
Disabled |
|
Show Raw Structure Of Objects In Variables Windows |
This option disables debugger customizations, such as the DebuggerDisplay attribute. |
Disabled |
|
Suppress JIT optimizations On Module Load (Managed Only) |
This option disables JIT optimizations, which can make code easier to debug. |
Enabled |
|
Warn If No Symbols On Launch (Native Only) |
This option displays a warning when no symbol information is available. |
Enabled |
Edit And Continue window Edit And Continue permits changes to the source code while debugging. The changes are applied immediately without having to rebuild and restart the application. Edit And Continue is automatically enabled when breaking and then stepping through an application.
Most changes within a method are supported, such as deleting a line of code. However, Edit And Continue supports few changes that are made outside of a method. For example, deleting class members is not allowed. The following changes are not supported in Edit And Continue:
-
Modifying an active statement.
-
Surrounding an active statement with a foreach, using, or lock block.
-
If the active statement is in the current stack frame, you cannot surround the active statement with a catch or finally block. You also cannot add a nested exception handler beneath six levels.
-
If the active statement is not in the current stack frame, you cannot surround the active statement with a try, catch, or finally block. In addition, you cannot add a nested exception handler beneath six levels. Finally, you cannot change the code in the try block that contains the active statement.
-
Adding a new member.
-
Adding or changing a global symbol.
-
Changing the signature of a member.
-
Editing an anonymous method or a function containing a anonymous method.
-
Changing, adding, or deleting an attribute.
-
Changing or deleting a local variable.
-
Modifying a method that contains a yield return or yield break statement.
-
Changing, adding, or deleting a using directive.
-
Modifying a constructor that contains a local variable that is initialized in an anonymous method.
Edit And Continue is not available in the following environments:
-
Mixed-mode debugging
-
SQL debugging
-
Unhandled exceptions, unless the Unwind The Call Stack On Unhandled Exceptions general debugging option is enabled
-
Attached application debugging
-
64-bit application debugging
-
After a failed rebuild of the current application
In the Edit And Continue window, the Edit And Continue feature can be enabled or disabled. Figure 12-5 shows the Edit And Continue window. The remaining settings pertain to native code.

Figure 12-5: Edit And Continue debug settings
Just-In-Time Debugging window The JIT debugger is attached to a running application when the program fails. Register Visual Studio as the JIT debugger in the Just-In-Time Debugging window. (See Figure 12-6.) Visual Studio can be the JIT debugger for Managed code, Native code, and Scripting. JIT debugging is discussed in the next chapter, "Advanced Debugging."

Figure 12-6: Just-In-Time Debugging window
Native window The Native window has two debugging options. Enable the Load DLL Exports option to load the export tables for DLLs. This is beneficial when the debug symbols are not available. For example, you can set breakpoints on functions exported from the library even though symbols are not available. The Enable RPC Debugging option enables stepping into Component Object Model (COM) remote procedure calls. Both options are disabled by default.
Symbols window Visual Studio can be configured to consult a symbol server and download the correct debugging symbols for the environment. Developers can use the Microsoft public symbol server or a local symbol server. Identify symbol servers and downstream paths in the Symbols window, which is shown in Figure 12-7. In the Symbol File Locations list box, symbol server paths can be entered or removed. Enter downstream servers in the Cache Symbols From Symbol Servers To This Directory Value.

Figure 12-7: Symbols window
Symbols can be loaded manually in the Modules window, as shown in Figure 12-8. Open the Modules window from the Debug menu and the Windows submenu. The Modules window lists the modules loaded in the current application. This window is applicable in break mode, not running mode. Each row of the window has the name of the module, path to the module, whether the module is optimized, source code availability, symbol status, and fully qualified path to the symbol file. The Symbol Status column indicates whether the symbols are loaded or skipped. Symbols are automatically skipped for optimized code. For skipped symbols, you can manually load the symbols for a specific module using the context menu. The Load Symbols menu command loads the symbols for the selected module. The Load Symbols and Symbol File columns are then updated. The Symbol Status column shows whether the symbols are successfully loaded for the module. The Symbol File column displays the path to the loaded symbol file. If the symbol file cannot be found for the specified module, you are prompted with the Find Symbols dialog box, as shown in Figure 12-9. From there, you can browse to the relevant symbol file.

Figure 12-8: Modules window

Figure 12-9: Find Symbols dialog box
From a module's context menu, the Symbol Load Information menu command displays general information about the symbols for the module. There is also a Symbol Setting menu command, which opens the Symbol debug window. You can configure symbols in this window.
Debug Settings for a Solution
Debug settings for a solution are set in the Solution property pages. The only settings available are Debug Source Files settings. (The Debug Source Files window is shown in Figure 12-10.) In this window, you can designate the directories that include and exclude source files.

Figure 12-10: Debug Source Files window
Debug Settings for a Project
Debug settings for a project set the startup action, command-line arguments, and other debug options. Figure 12-11 shows the Debug pane of the Project Property pages.

Figure 12-11: Debug pane of the Project Property pages
The Start Action option box indicates the startup action for debugging, which determines the application to launch when starting a debugging session. Here are the options:
-
The Start Project option, which is the default, starts the application of the startup project.
-
The Start External Program option is typically selected to debug class library projects. Specify the hosting application that loads the DLL of the class library project. You can then debug into the class library.
-
The Start Browser With URL option is useful for debugging Web applications. Browse to a URL that is controlled by the Web application. The Web application is then loaded via the Web server, which provides an opportunity to debug the Web application.
The Start Options option box contains the following miscellaneous settings:
-
Enter command-line arguments for the application in the Command Line Arguments text box.
-
The Working Directory text box sets the working directory of the application. This is the default path for directory- and file-related tasks.
-
The Use Remote Machine option names a remote machine, where the target application resides.
The Enable Debuggers option box indicates the kind of code that can be debugged:
-
The Enable Unmanaged Code Debugging option enables mixed-mode debugging. Developers can debug between managed and unmanaged code.
-
The Enable SQL Server Debugging option allows developers to debug CLR assemblies running within Microsoft SQL Server 2005.
-
The Enable The Visual Studio Hosting Process option activates the Visual Studio hosting process, which is a new feature in Visual Studio 2005.
Visual Studio Debugging User Interface
The user interface in Visual Studio 2005 has new debugging features, which include data tips and visualizers. These enhancements improve developers' debugging experience. Other features, such as tracepoints, represent improvements of existing features. Tracepoints are a new style of breakpoints.
Data Tips
While you are debugging, a data tip is displayed when the cursor is paused over a variable. Previously, data tips were helpful when viewing simple types, such as integers and other value types. However, the details of a complex type were not visible in a data tip. In Visual Studio 2005, data tips are improved and can display the fields of a complex type. The complex type is at first collapsed in the data tip. Expansion displays the type members and values in the data tip.
Visualizers
Visualizers display the underlying HTML, XML, or text associated with a data tip. For example, the improved data tip can display the composition of a dataset, which is a complex type. A dataset is more than the composition of all its members. Datasets are an abstraction of an XML data source. The ability to view the underlying data while debugging is invaluable. Imagine programmatically parsing XML data and receiving incorrect results. You need to know if the problem is in the XML or the program logic. The XML Visualizer provides a convenient way to view the source XML data.
Data tips now have an optional menu that displays available visualizers. When a data tip detects values that are compatible with a visualizer, the visualizer menu is automatically displayed.
In the following code, myxml is a field that contains XML. The XML defines an array of books.
private string myxml = "<books><book><title>" +
    "The Gourmet Microwave</title>" +
    "<price>19.95</price>" +
    "</book><book><title>Sushi, Anyone?</title>" +
    "<price>49.99</price></book></books>";
The following code changes the content of the myxml field:
 string newbook="<book><title>" +
     "Donis's Great Adventure</title>" +
     "<price>9.95</price>" +
     "</book>";

myxml=myxml.Insert(5, newbook);
A string that contains XML, which describes another book, is added to the myxml string. A data tip can easily display the modified myxml string. Viewing myxml as XML provides additional clarification and important information. Move the cursor over the myxml variable, and a data tip appears. The modified string is displayed. From the data tip menu, select XML Visualizer. The XML Visualizer opens, as shown in Figure 12-12. The Visualizer uncovers a problem, which is that the underlying XML is not well-formed. Why not? The additional book was inserted at the wrong location in the myxml string, which is not detected from a simple data tip. However, the problem is caught by the Visualizer.

Figure 12-12: XML Visualizer uncovers a problem
The following code is modified to insert the book at the correct location in the myxml string. Now the XML Visualizer correctly displays the XML of the string. (See Figure 12-13.) You have just found and successfully resolved a bug!

Figure 12-13: XML Visualizer of myxml
myxml=myxml.Insert(7, newbook);
Visualizers are extensible; developers can create user-defined visualizers. The DataSet Visualizer is an example of a custom visualizer. It will display the data behind a dataset, which is very helpful. The following code displays rows in a dataset. A breakpoint is placed on the highlighted line.
DataSet ds = new DataSet();
ds.ReadXml(@"C:\Xml\titles.xml");
DataRowCollection rows = ds.Tables[0].Rows;

foreach (DataRow row in rows)
{
    lblData.Items.Add(row[0].ToString());
}
The cursor is placed over the ds variable, which is an instance of a dataset. A data tip appears, which has several rows. There is a Visualizer menu on the row of the DataSet type. Choose the DataSet Visualizer from the menu. The dataset is then displayed in DataSet Visualizer window, with the results shown in Figure 12-14. From here, you can choose the data table to view, sort the data columns, and make basic changes to the fields.

Figure 12-14: Dataset Visualizer
Breakpoints
Breakpoints are stop signs in code where execution is interrupted. When a breakpoint is hit, the application enters the break mode. You can then debug the application with a variety of Visual Studio debugger commands. There are different kinds of breakpoints. A normal breakpoint appears as a red circle to the left of the target.
The F9 function key is the breakpoint command that sets a simple breakpoint on the selected line of source code. F9 is a toggle, which sets or clears a breakpoint. In addition, clicking in the leftmost dimmed column sets or clears a breakpoint. The Continue menu command (F5) on the Debug menu resumes an application. The application runs until another breakpoint is hit, the application is otherwise interrupted, or the debug session ends. Other commands, such as Run To Cursor, also resume execution.
You can add new breakpoints from the Debug menu and the New Breakpoint submenu. Break At Function adds a function breakpoint. New Data Breakpoint sets a breakpoint that breaks when a variable has changed. This option is not available in C# or Microsoft Visual Basic .NET.
Function Breakpoints
Function breakpoints break on the first line of a function and can be set at compile time or run time.
Set a function breakpoint from the New Breakpoint submenu. Choose the Break at Function command. Figure 12-15 shows the New Breakpoint dialog box. The shortcut key is Ctrl+B. In this example, a breakpoint is set on the first line of the WClass.MethodA function. As a shortcut, select the name of the target function first and open the New Breakpoint dialog box. The function name will automatically appear in the New Breakpoint dialog box. If you're breaking on an ambiguous or overloaded name, the Choose Breakpoints dialog box opens. For example, in the sample code, MethodA is ambiguous. There are several instances of MethodA in the application. In Figure 12-16, the New Breakpoint dialog box sets a breakpoint on MethodA. Figure 12-17 displays the Choose Breakpoints dialog box that subsequently appears, in which the user can select a specific location to set the breakpoint. To avoid ambiguity, you can enter the class name (Classname.Methodname) or the method signature.

Figure 12-15: New Breakpoint dialog box

Figure 12-16: Setting a breakpoint on MethodA

Figure 12-17: Choose Breakpoints dialog box
The Use IntelliSense To Verify The Function Name option of the New Breakpoint dialog box requests the Choose Breakpoint dialog box whenever a user enters an ambiguous or overloaded function name. With this option, users are notified of invalid function names. With the option disabled, there is no notification, and the New Breakpoint dialog box simply closes without setting the breakpoint.
You can also set breakpoints in the Call Stack window, which is available on the Debug menu within the Windows submenu. A function breakpoint on the call stack breaks upon re-entering that method as the stack unwinds. For example, MethodA calls MethodB. MethodB then calls MethodC. A breakpoint is then set on MethodA in the Call Stack window. When MethodB returns and the related stack frame is removed, the application is interrupted on re-entering MethodA. The Call Stack window is available in break mode. Set a breakpoint for a specific method using the context menu or the F9 breakpoint keyboard shortcut. A breakpoint set on MethodA in the call stack is exhibited in Figure 12-18.

Figure 12-18: Breakpoint in the Call Stack window
Breakpoints Window
Developers can manage breakpoints in the Breakpoints window (opened from the Debug menu and the Windows submenu). Figure 12-19 shows the Breakpoints window.

Figure 12-19: Breakpoints window
In the Breakpoints window, breakpoints are shown on separate rows. The first column of each row is the enabled/disabled options box. If a breakpoint is enabled, the option box is checked. Uncheck the column to disable the breakpoint. The next column provides the description and location of the breakpoint. The Condition column shows any conditions set on the breakpoint. The final column shows the hit count. In that column, Break Always means that the program is interrupted every time the breakpoint is hit.
The context menu has several valuable options that affect the selected breakpoint. The first menu command is Delete, which removes the breakpoint. The Go To Source Code menu command redirects to the breakpoint in the source code. The Go To Disassembly menu command redirects to the disassembly at the breakpoint. For this command, the application must be in break mode. The remaining commands of the context menu customize the selected breakpoint and are explained in the following sections.
Location This command changes the location of a breakpoint. You are presented with the Address Breakpoint or File Breakpoint dialog box (shown in Figures 12-20 and 12-21). The Address Breakpoint dialog box is displayed for memory breakpoints, such as a breakpoint set on the call stack. The File breakpoint dialog box is displayed for line breakpoints in source code.
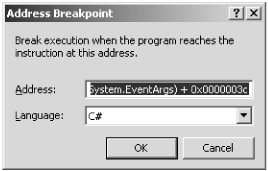
Figure 12-20: Address Breakpoint Dialog Box

Figure 12-21: File Breakpoint Dialog Box
Condition This command sets additional criteria for honoring a breakpoint. The condition can be a Boolean expression. If true, the breakpoint is honored. Otherwise, the breakpoint is ignored. The condition can also be based on changes to a value. If the value is changed, the breakpoint is honored.
Look at the following sample code. The breakpoint is set on the dimmed line. We want to honor the breakpoint only when ivalue contains an even value.
int[] numbers ={1,2,3,4,5,6,7,8,9,10,
    11,12,13,14,15,165,17,18,18,20};
int total = 0;

foreach (int ivalue in numbers)
{
    total += ivalue;
}
The Breakpoint Condition dialog box, shown in Figure 12-22, sets the condition to break on even values.

Figure 12-22: Conditional Breakpoint dialog box
Hit Count This command honors a breakpoint based on the hit count. Table 12-3 lists the hit count options.
|
Option |
Description |
|---|---|
|
Break Always |
This option always honors the breakpoint. |
|
Break When The Hit Count Is Equal To |
This option honors the breakpoint when that instance of the breakpoint occurs. For example, interrupt on the fourth occasion of a specific breakpoint. |
|
Break When The Hit Count Is A Multiple Of |
This option honors the breakpoint as a multiple of a value, for example, every third instance of the breakpoint. |
|
Break When The Hit Count Is Greater Than Or Equal To |
This option honors the breakpoint starting at a certain instance; for example, honor the breakpoint at the third and every successive instance. |
The Breakpoint Hit Count dialog box, shown in Figure 12-23, honors every third instance of the selected breakpoint.

Figure 12-23: Breakpoint Hit Count dialog box
Filter This command sets the affinity of a breakpoint to a machine, thread, or process. The breakpoint interrupts only in the context of the stated filter. Table 12-4 lists the available contexts.
|
Context |
Description |
|---|---|
|
MachineName |
This context is the name of the machine. Breakpoint is honored if the process is running on that machine. |
|
ProcessId |
This context is the process identifier. Breakpoint is honored if code is executing in the specified process. |
|
ProcessName |
This context is the process name. Functionally equivalent to the ProcessId context. |
|
ThreadId |
This context is the thread identifier. Breakpoint is honored if code is executing on a specific thread. |
|
ThreadName |
This context is the thread name. Functionally equivalent to the ThreadId context. |
The following code creates two threads that asynchronously execute the same method (MethodA). The threads are named FirstThread and SecondThread. A breakpoint is set on the highlighted line in MethodA. As a standard breakpoint, both threads are interrupted—probably alternating between the threads.
private void btnFilter_Click(object sender, EventArgs e)
{
    Thread t1=new Thread(new
        ThreadStart(MethodA));
    t1.Name="FirstThread";
    t1.IsBackground=false;
    Thread t2=new Thread(new
        ThreadStart(MethodA));
    t2.Name="SecondThread";
    t2.IsBackground = false;
    t1.Start();
    t2.Start();
}

public void MethodA()
{
    while (true)
    {
        Thread.Sleep(3000);
    }
}
To break on the first thread alone, open the Breakpoint Filter dialog box, shown in Figure 12-24. Specify FirstThread as the thread name. Future instances of the breakpoint interrupt the first thread, but not the second thread. You can confirm the results in the Threads window.

Figure 12-24: Breakpoint Filter dialog box
When Hit This command creates a tracepoint (discussed in the next section).
The Breakpoints window toolbar, shown in Figure 12-25, offers several shortcuts. The controls on the toolbar are New, Delete, Delete All Breakpoints, Disable All Breakpoints, Go To Source Code, Go To Disassembly, and Columns. The New drop-down list inserts a new function or data breakpoint. Data breakpoints are not available in managed code. The Columns button customizes the content of the Breakpoints window, in which developers can add or remove columns of information.
Figure 12-25: Breakpoints window toolbar
Tracepoints
Tracepoints assign an operation to a breakpoint. You can assign source code or a macro to a breakpoint. When the breakpoint is hit, the source code or macro is executed. Before tracepoints, this process required two steps: setting a breakpoint and inserting temporary code into source file. When the breakpoint was no longer needed, the developer had to remember to remove the temporary code.
There are two methods for setting a tracepoint. You can open the context menu on the source line in which the tracepoint should be inserted. Select the Breakpoint submenu and the Insert Tracepoint menu command. Alternatively, you can open the context menu on a source line that already contains a breakpoint. From the Breakpoint submenu, choose the When Hit menu command. Either approach opens the When Breakpoint Is Hit dialog box, in which a tracepoint is defined. (See Figure 12-26.)

Figure 12-26: When Breakpoint Is Hit dialog box
In the Print A Message edit box, enter a display string for the output window. Expressions are entered within curly braces: {expression}. Special keywords can be used, such as $ADDRESS, $TID, and $FUNCTION. In the Run A Macro edit box, enter the name of a macro. This macro is run when the breakpoint is hit. The Continue Execution option sets a soft breakpoint. When the breakpoint is hit, soft breakpoints do not interrupt the application; they execute the designated code or macro. Soft breakpoints appear as diamonds in the source code editor.
The statement in the following When Breakpoint Is Hit dialog box (shown in Figure 12-27) adds two local variables and displays the results in the output window.

Figure 12-27: Print a message selected in the When Breakpoint Is Hit dialog box
From the preceding tracepoint, the following code is displayed in the Output window:
Function: WindowsApplication1.WClass.MethodA() [5 + 10 = 15]
Table 12-5 lists the special keywords that can be used in the Print a message statement.
|
Keyword |
Description |
|---|---|
|
$ADDRESS |
This keyword returns the address of the current instruction. |
|
$CALLER |
This keyword returns the name of the previous function on the call stack, which is the calling function. |
|
$CALLSTACK |
This keyword returns the call stack. |
|
$FUNCTION |
This keyword returns the name of the current function. |
|
$PID |
This keyword returns the process identifier of the current process. |
|
$PNAME |
This keyword returns the name of the current process. |
|
$TID |
This keyword returns the thread identifier of the current thread. |
|
$TNAME |
This keyword returns the name of the current thread. |
Breakpoint Symbols
Breakpoints are annotated with icons in both the source code and the Breakpoints window. Each category of breakpoint has a different symbol, as described in Table 12-6.
|
Symbol |
Description |
|---|---|
|
Filled circle |
This icon signifies a normal breakpoint, such as a function or location breakpoint. |
|
Diamond |
This icon signifies a tracepoint that has the Continue execution option enabled. |
|
Filled circle with a plus + |
This icon signifies a filter breakpoint. Filter breakpoints include the Condition, Hit Count, and Filter breakpoints. |
|
Hollowed circle |
This icon signifies a disabled breakpoint. |
Code Stepping
Stepping through source code is the most common action in a debugging session. Step commands execute an application in source line increments. With each step, execution continues incrementally. Between steps, expressions can be evaluated, variables updated, functions called, and scope changed. Debug windows are updated at each step to reflect any changes that occurred during the partial execution. This sometimes requires refreshing. Extensive monitoring and expressions in debug windows can precipitously hurt performance.
Step Commands
There are several step commands, descr


