Dumps
Dumps
Dumps are used for postmortem analysis, which is sometimes the most effective means of debugging an application. When a program intermittently crashes, postmortem analysis may be the sole option to resolve the problem. You can capture a dump when the crash occurs, which is then used to diagnose the problem. Production applications are not ideal for live debugging. How do you perform live debugging on an active Web server? Convenience is another advantage to postmortem analysis. You remove the dump to a developer machine that hosts an assortment of debugging tools and resources. In this environment, diagnosing the problem is much easier.
Postmortem analysis is usually conducted by scrutinizing a dump, which is a memory snapshot of an application. There are full dumps and minidumps. A minidump is only a snapshot of the application memory. Full dumps also include other modules in the memory snapshot—even system modules. The benefit of a full dump is convenience, and symbols are more easily aligned. The disadvantage is that full dumps tend to be large. Not all minidumps are equivalent—some minidumps contain more information than others. Check the documentation for the command or tool that creates a minidump to confirm what the minidump includes.
Remember that memory dumps are static. The debugging paradigm is different from performing live debugging. You cannot step through the application, threads cannot be restarted, and so on.
As documented earlier, the .dump directive in WinDbg creates dump files. Dump files can also be created with ADPlus and Dr. Watson tools.
ADPlus
The ADPlus tool is downloaded from the Debugging Tools for Windows Web site at Microsoft.com. It is a Microsoft VBScript that automates the CDB debugger. Use ADPlus to debug applications that hang or crash. The utility creates dump and log files for postmortem analysis. Unique names are assigned to these files to avoid overriding previously generated files. ADPlus operates in either the crash or hang mode.
In crash mode, ADPlus attaches cdb to the target processes. It is attached invasively. You run ADPlus before the application crashes. At that time, a minidump and log file are created. ADPlus will also write an entry into the Event Log. A crash is interpreted as the application ending from an unhandled exception or other abnormal condition. To detach prematurely before a crash, open the minimized CDB console window and press Ctrl+C. This is the syntax of running ADPlus in the crash mode. Multiple processes can be attached to simultaneously. All instances of the named processes are attached.
adplus -crash -pn processname1 -pn processname2 -pn processnamen
Alternatively, the process identifier can be used to identify the target processes:
-
adplus -crash -p pid1 -p pid2 -p pidn
In hang mode, run ADPlus after the hang occurs, which attaches CDB to the target application noninvasively. The debuggee is resumed after the dump is created. This is the syntax to start ADPlus in the hang mode:
-
adplus -hang -pn processname1 -pn processname2 -pn processnamen
-
adplus -hang -p pid1 -p pid2 -p pidn
There are three other options worth mentioning:
-
O(utput) option This option sets the output directory for dump and log files.
-
Q(uiet) option This option suppresses alerts related to ADPlus.
-
N(otify) option This option notifies a user that an application has crashed.
ADPlus Walkthrough The Store application for this walkthrough has an error and unexpectedly crashes. ADPlus is used to create a dump when the application crashes. The dump is then opened in WinDbg, and the problem is isolated:
-
Start the Store application.
-
Click the Hang button. As expected, this procedure hangs the application.
-
Run ADPlus in hang mode to attach the CDB debugger to the Store application. Get the correct process identifier from the tlist utility:
C:\store>adplus -hang -p 3520 -o c:\dumps Attaching the debugger to: STORE.EXE (Process ID: 3520) -
Start WinDbg and open the dump. From the File menu, choose the Open Crash Dump command. Find and open the dump.
-
Load the Son of Strike extension. Change to Thread 0 and request a managed stack trace. The following is a partial listing of the call stack. It shows correctly that the btnHang_Click handler was the last method entered. This provides a starting point in uncovering the culprit that caused the hang.
0:000> .load sos
0:000> !clrstack
OS Thread Id: 0xae8 (0)
ESP       EIP

0012f030 00de0906 Store.Form1.btnHang_Click(System.Object, System.EventArgs)
0012f044 7b070a8b System.Windows.Forms.Control.OnClick(System.EventArgs)
0012f054 7b114cd9 System.Windows.Forms.Button.OnClick(System.EventArgs)
0012f060 7b114ddf System.Windows.Forms.Button.OnMouseUp(System.Windows.Forms.MouseEventArgs)
0012f084 7b0dfeea System.Windows.Forms.Control.WmMouseUp(System.Windows.Forms.Message
ByRef, System.Windows.Forms.MouseButtons, Int32)
0012f0d0 7b082bbf System.Windows.Forms.Control.WndProc(System.Windows.Forms.Message ByRef)
0012f0d4 7b09149e [InlinedCallFrame: 0012f0d4]
0012f170 7b0913bb System.Windows.Forms.Button.WndProc(System.Windows.Forms.Message ByRef)
0012f178 7b08a70d System.Windows.Forms.Control+ControlNativeWindow.OnMessage(System.Wi
ndows.Forms.Message ByRef)
0012f17c 7b08a6e6 System.Windows.Forms.Control+ControlNativeWindow.WndProc(System.Windows
.Forms.Message ByRef)
0012f190 7b08a535 System.Windows.Forms.NativeWindow.Callback(IntPtr, Int32, IntPtr, IntPtr)
0012f324 003420d4 [NDirectMethodFrameStandalone: 0012f324] System.Windows.Forms.Unsafe
NativeMethods.DispatchMessageW(MSG ByRef)
0012f334 7b094682 System.Windows.Forms.Application+ComponentManager.System.Windows.For
ms.UnsafeNativeMethods.IMsoComponentManager.FPushMessageLoop(Int32, Int32, Int32)
0012f3d4 7b094249 System.Windows.Forms.Application+ThreadContext.RunMessageLoopInner(I
nt32, System.Windows.Forms.ApplicationContext)
0012f440 7b094087 System.Windows.Forms.Application+ThreadContext.RunMessageLoop(Int32,
 System.Windows.Forms.ApplicationContext)
0012f470 7b0d66ea System.Windows.Forms.Application.Run(System.Windows.Forms.Form)
0012f480 00de00a8 Store.Program.Main()
0012f69c 79e80b8b [GCFrame: 0012f69c]
Dr. Watson
Dr. Watson (drwtsn32.exe) also creates dumps. This product is installed with the operating system. On nondeveloper machines, Dr. Watson is the only JIT debugger present. Dr. Watson attaches to a failing application to create a log file and optionally a dump file.
Figure 13-8 shows the main window of Dr. Watson. In this window, you configure Dr. Watson for JIT debugging.
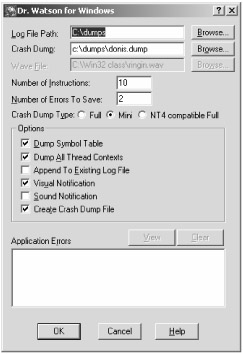
Figure 13-8: Main window of Dr. Watson
The following list describes the configurable items in the Dr. Watson window:
-
Log File Path The path for the log files created by the Dr. Watson.
-
Crash Dump The path and name of the dump file.
-
Wave File The path to whatever musical accompaniment you deem appropriate for an application failure. Flight of the Valkyrie might be appropriate.
-
Number of Instructions The number of instructions to disassemble around the instruction pointer.
-
Number of Errors to Save The maximum number of errors to save in the log file.
-
Crash Dump Type The type of dump request: full, mini, or NT-compatible.
-
Dump Symbol Table Dump the name and address of every symbol into the log file.
-
Dump All Thread Contexts Include the thread context, register values, and other context data in the log file.
-
Append To Existing Log File Add the next log entry from a program failure to the current log file. If not selected, a new log file is created for each failure.
-
Visual Notification Display a dialog box to notify of program failure and just-in time debugging.
-
Sound Notification Play the Flight of the Valkyrie or whatever WAV file is specified.
-
Create Crash Dump File When a program fails, create a dump file.
Dr. Watson Walkthrough Following is a walkthrough of Dr. Watson, which is the only walkthrough that does not use the Store application. The walkthrough uses the Crash application. The Crash application fails immediately after the application is launched.
-
Make sure that Dr. Watson is installed as the native debugger.
C:\>drwtsn32 -i
-
Configure Dr. Watson to create a minidump file, set the dump file path and name, and then request notification. Accept all other defaults.
-
Run the Crash program. This program should immediately hang, which will prompt notification from Dr. Watson.
-
Confirm that the dump and log file are created. Inspect the log file, which includes general information, system information, task list, module list, thread context, stack trace, symbol table, and a variety of raw dumps:
Microsoft (R) DrWtsn32
Copyright (C) 1985-2001 Microsoft Corp. All rights reserved.

Application exception occurred:
        App: C:\codew\Crash\Debug\Crash.exe (pid=4004)

        When: 9/5/2005 @ 08:19:29.796
        Exception number: 80000007
()

*----> System Information <----*
        Computer Name: DONISMLAPTOP
        User Name: Donis
        Terminal Session Id: 0
        Number of Processors: 2
        Processor Type: x86 Family 15 Model 2 Stepping 9
        Windows Version: 5.1
        Current Build: 2600
        Service Pack: 2
        Current Type: Multiprocessor Free
        Registered Organization:
        Registered Owner: Donis

*----> Task List <----*
   0 System Process
   4 System
 788 smss.exe
 908 csrss.exe
 932 winlogon.exe
 976 services.exe
 988 lsass.exe
1152 svchost.exe
1220 svchost.exe

*----> Module List <----*
(0000000000400000 - 000000000041a000: C:\codew\Crash\Debug\Crash.exe
(0000000010200000 -
0000000010320000: C:\WINDOWS\WinSxS\x86_Microsoft.VC80.DebugCRT_1fc8b3b9a1e18e3b_8.0.
50727.7_x-ww_ec5d0b23\MSVCR80D.dll
(00000000629c0000 - 00000000629c9000: C:\WINDOWS\system32\LPK.DLL
(0000000074d90000 - 0000000074dfb000: C:\WINDOWS\system32\USP10.dll
(0000000076390000 - 00000000763ad000: C:\WINDOWS\system32\IMM32.DLL
(0000000077b40000 - 0000000077b62000: C:\WINDOWS\system32\Apphelp.dll
(0000000077c00000 - 0000000077c08000: C:\WINDOWS\system32\VERSION.dll
(0000000077c10000 - 0000000077c68000: C:\WINDOWS\system32\msvcrt.dll
(0000000077d40000 - 0000000077dd0000: C:\WINDOWS\system32\USER32.dll

*----> State Dump for Thread Id 0xb5c <----*

eax=00390000 ebx=0012f6fc ecx=00001000 edx=7c90eb94 esi=0000007c edi=00000000
eip=7c90eb94 esp=0012f6e0 ebp=0012f9e8 iopl=0         nv up ei pl nz na pe nc
cs=001b  ss=0023  ds=0023  es=0023  fs=003b  gs=0000             efl=00000202

*----> Stack Back Trace <----*
ChildEBP RetAddr  Args to Child
0012f9e8 102116d1 0012fa5c 00000002 00000000 ntdll!KiFastSystemCallRet
0012fa0c 004119a2 c0000005 0012fa5c 1021c2b4 MSVCR80D!XcptFilter+0x61
0012fa18 1021c2b4 00000000 00000000 00000000 Crash!__tmainCRTStartup+0x1f2
0012ffb8 0041179d 0012fff0 7c816d4f 023dd680 MSVCR80D!seh_longjmp_unwind4+0x2e
0012ffc0 7c816d4f 023dd680 7c90e1fe 7ffdd000 Crash!wmainCRTStartup+0xd


