Son of Strike (SOS)
Son of Strike (SOS)
SOS is a debugger extension for debugging managed code and is used in collaboration with the unmanaged debugger to diagnose abnormal conditions. Expect that some problems cannot be isolated with SOS alone. It is the collaboration between the unmanaged debugger and SOS that is powerful. Problems in managed applications are diagnosable without SOS, but that requires your interpretation of complex commands and internal structures. With SOS, that challenge is avoided, allowing developers to concentrate on the problem—debugging the application.
Any of the following statements loads the SOS extension DLL. To load a particular version of SOS, provide a fully qualified directory path. When live debugging, the current version of WinDbg automatically loads SOS. However, it is not automatically loaded for postmortem analysis.
.load sos
.load sos.dll
.load c:\path\sos.dll
SOS Walkthrough Part I
This walkthrough is an introduction to SOS. Details from previous walkthroughs and demonstration are omitted for brevity. Some of the listings have also been abbreviated for clarity.
-
Start the Store application. Open the Transaction dialog box, as shown in Figure 13-7. For this debugging session, do not complete or close this dialog box.
-
Launch the WinDbg debugger and then attach it to the Store application.
-
SOS has a !threads command, which lists the managed threads of the application. Use the !threads command. This is the abbreviated result:
0:004> !threads ThreadCount: 2 UnstartedThread: 0 BackgroundThread: 1 PendingThread: 0 DeadThread: 0 Hosted Runtime: no PreEmptive GC Alloc Lock ID OSID ThreadOBJ State GC Context Domain Count 0 1 424 001501f8 6020 Enabled 013da5dc:013dadb8 001483a8 0 2 2 c24 00153e40 b220 Enabled 00000000:00000000 001483a8 0 -
Change to Thread 0, which is a managed thread.
0:004> ~0s
eax=790ff90c ebx=01392b50 ecx=013a7704 edx=0000ce7d esi=00000000 edi=013da5b8
eip=7c90eb94 esp=0012edb4 ebp=0012ee4c iopl=0         nv up ei pl zr na po nc
cs=001b  ss=0023  ds=0023  es=0023  fs=003b  gs=0000             efl=00000246
ntdll!KiFastSystemCallRet:
7c90eb94 c3               ret
-
Enter the !clrstack command to show a stack trace of the current thread. The p option requests that the parameters be displayed.
0:000> !clrstack -p OS Thread Id: 0x424 (0) ESP EIP 0012edc0 7c90eb94 [InlinedCallFrame: 0012edc0] System.Windows.Forms.UnsafeNativeMethod s.WaitMessage() 0012edbc 7b094838 System.Windows.Forms.Application+ComponentManager.System.Windows.For ms.UnsafeNativeMethods.IMsoComponentManager.FPushMessageLoop(Int32, Int32, Int32) PARAMETERS: this = 0x013a76ac dwComponentID = <no data> reason = 0x00000004 pvLoopData = 0x00000000 0012eef8 7b22e03e System.Windows.Forms.Form.ShowDialog(System.Windows.Forms.IWin32Window) PARAMETERS: this = 0x013b4494 owner = <no data> -
The ShowDialog method appears in the stack trace, where the parameters are also shown. The this reference is the first parameter of the method. Use the dumpobj command to dump the this reference, which confirms that the Store.Transaction form is displayed.
0:000> !dumpobj 0x013b4494
Name: Store.Transaction
MethodTable: 00d453a4
EEClass: 00db3034
Size: 372(0x174) bytes
 (C:\store\Store.exe)
Fields:
      MT    Field   Offset                 Type VT      Attr    Value Name
790fa098  4000184        4        System.Object  0  instance 00000000 __identity
7a765ca4  40008bc        8 ...ponentModel.ISite  0  instance 00000000 site
7a762e84  40008bd        c ....EventHandlerList  0  instance 013b6964 events
790fa098  40008bb      108        System.Object  0    static 00000000 EventDisposed
7b4777e4  40010fa       10 ...ntrolNativeWindow  0  instance 013b55c4 window
7b4754b4  40010fb       14 ...ows.Forms.Control  0  instance 00000000 parent
7b4754b4  40010fc       18 ...ows.Forms.Control  0  instance 00000000 reflectParent
7b478924  40010fd       1c ...orms.CreateParams  0  instance 013b560c createParams
790fe920  40010fe       34         System.Int32  0  instance      346 x
790fe920  40010ff       38         System.Int32  0  instance       22 y
790fe920  4001100       3c         System.Int32  0  instance      266 width
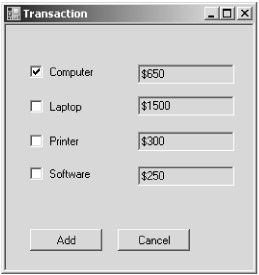
Figure 13-7: Store application and the Transaction dialog box
SOS Commands
Table 13-7 is an overview of some of the SOS commands. For a complete listing, see the help command.
|
Command |
Description |
|---|---|
|
!ClrStack |
This command displays the call stack of the current thread. Here are some of the options:
|
|
!DumpHeap |
This command first displays the objects that are on the managed heap. It then displays statistics about the type of objects on the managed heap. Here are some of the options:
|
|
!DumpIL mdaddress |
This command dumps the MSIL of the method associated with the method descriptor. |
|
!DumpMT mtaddress |
This command dumps information about the method table. The -md option lists information on the method descriptors in the method table, such as the function names and method descriptor addresses. |
|
!DumpObj objaddress |
This command dumps information on the specific object. |
|
!DumpStackObjects option |
This command lists value types and references that are on stack of the current thread. The only option is -verify. |
|
!EEHeap options |
This command dumps information on Generation 0, 1, 2, and the managed heap. The -loader option lists the private heaps of each AppDomain, module, and heap associated with the JIT compiler. |
|
!EEVersion |
This command displays information of the run-time environment, such as the version number. |
|
!FinalizeQueue option |
This command lists the objects on the finalization queue. For additional information on SyncBlocks and RuntimeCallableWrappers, use the -detail option. |
|
!GCroot -options objaddress |
This command lists instances that hold references to the specified object. The -nostacks option excludes references held on the stack. |
|
!IP2MD jitaddress |
This command displays the method descriptor of a jitted method. |
|
!Name2EE program target |
If target is a type, the command dumps the method table of that type. If target is a method name, the method descriptor of that method is dumped. |
|
!Syncblk |
This command lists the indexes of the sync block table. |
|
!Threads |
This command lists the managed threads. |
|
!Token2EE token |
For this command, the token must be an entry of the typedef or methoddef table. If it is a typedef token, the method table address and other information about the token are displayed. If it is a methoddef token, the corresponding method descriptor is displayed. |
|
!Help command |
This command displays detailed help on SOS commands. Without the command option, an overview of all the commands is displayed. |
SOS Walkthrough Part II
Now that a few more commands have been introduced, an additional walkthrough is helpful. The following walkthrough dumps the source code, MSIL, and assembly code of the btnTransaction_Click button handler, which is informative.
-
Start the walkthrough by running the Store application and attach WinDbg to the application.
-
Dump information about the btnTransaction_Click method with the !name2ee command. Notice that the method has not been jitted yet, which means that the method has not been invoked before. A function is jitted when it is first invoked.
0:004> !name2ee store.exe Store.Form1.btnTransaction_Click
Module: 00d40c14 (Store.exe)
Token: 0x06000004
MethodDesc: 00d43968
Name: Store.Form1.btnTransaction_Click(System.Object, System.EventArgs)
Not JITTED yet. Use !bpmd -md 00d43968 to break on run.
0:004> !u 00d43968
Not jitted yet
-
Continue the Store application using the g(o) command and click the Add Transactions button. Interrupt the program in the debugger with Ctrl+Break. Dump information on Store.Form1.btnTransaction_Click again. This time, the method is shown as jitted, and the virtual address of the cached native binary is displayed:
0:004> !name2ee store.exe Store.Form1.btnTransaction_Click
Module: 00d40c14 (Store.exe)
Token: 0x06000004
MethodDesc: 00d43968
Name: Store.Form1.btnTransaction_Click(System.Object, System.EventArgs)
JITTED Code Address: 00de07c0
-
The !u command displays the assembly code of a jitted method. Use this command for the btnTransaction_Click method:
0:004> !u 00d43968
Normal JIT generated code
Store.Form1.btnTransaction_Click(System.Object, System.EventArgs)
Begin 00de07c0, size 3e9
00de07c0 55               push    ebp
00de07c1 8bec             mov     ebp,esp
00de07c3 57               push    edi
00de07c4 56               push    esi
00de07c5 53               push    ebx
00de07c6 83ec50           sub     esp,0x50
00de07c9 33c0             xor     eax,eax
00de07cb 8945d0           mov     [ebp-0x30],eax
00de07ce 8945c4           mov     [ebp-0x3c],eax
00de07d1 33c0             xor     eax,eax
00de07d3 8945e8           mov     [ebp-0x18],eax
00de07d6 894dc0           mov     [ebp-0x40],ecx
00de07d9 8955dc           mov     [ebp-0x24],edx
00de07dc 833dc80dd40000   cmp     dword ptr [00d40dc8],0x0
-
Challenge two is to list the MSIL code for the btnTransaction_Click method. The dumpil command shows the MSIL code of the method:
0:004> !dumpil 00d43968 ilAddr = 0040247c IL_0000: nop .try { IL_0001: nop IL_0002: ldarg.0 IL_0003: ldfld Store.Form1::txtNumber IL_0008: callvirt System.Windows.Forms.Control::get_Text IL_000d: call System.Int32::Parse IL_0012: stloc.0 IL_0013: nop IL_0014: leave.s IL_001d } // end .try .catch { IL_0016: pop IL_0017: nop IL_0018: ldc.i4.1 IL_0019: stloc.0 IL_001a: nop IL_001b: leave.s IL_001d } // end .catch -
The final task is to display the source code. Set the source code path in WinDbg. From the File menu, choose the Source File Path command and then enter the source code path. Enter the lsf command to set form1.cs as the source code file. List the source with the ls command. For the walkthrough, lines 10 to 50 are displayed:
0:004> lsf form1.cs
0:004> ls 10, 40
    22:
    23:         private void btnTransaction_Click(object sender, EventArgs e)

    24:         {
    25:              int numofTransactions;
    26:              try
    27:              {
    28:                  numofTransactions= int.Parse(txtNumber.Text);
    29:              }
    30:              catch
    31:              {
    32:                  numofTransactions = 1;
    33:              }
    34:              for (int count = 0; count < numofTransactions; ++count)
    35:              {
    36:                  int itemTotal=0;


