Debugging with Visual Studio .NET
Microsoft Visual Studio .NET includes an integrated debugger that can be used to debug your Visual C# projects. Because the debugger is integrated into the same tool used to edit and compile your Visual C# code, the compile/test/debug cycle is greatly simplified.
When your Visual C# project is created, it has two configurations: Debug and Release. The Debug configuration generates symbolic information that's used by the debugger; this information isn't included when building a project with the default Release configuration.
Breakpoints are code locations that cause the debugger to pause (or break) execution of your program. A breakpoint is typically used to halt the debugger in an interesting location. For example, let's say your application isn't responding correctly after receiving user input. By setting a breakpoint at the location in your code that handles input from the user, you cause the debugger to pause execution at the specified point. While stopped at a breakpoint, you can inspect the program variables, change the path of program execution, or step through your program's instructions.
Breakpoints can be added on any line of your Visual C# source code that contains a program statement. A breakpoint is set by pressing F9 while the insertion point is on a line in your program. If the breakpoint is set successfully, a red dot will be displayed in the left margin of the Text Editor window. Each time you press F9, the breakpoint will be toggled on or off. The other function keys often used during debugging are listed in Table 9-3.
While your program is stopped at a breakpoint, you can inspect and modify variables in several ways. If you hover the mouse pointer over a variable, the type and value of the variable will be displayed in a ToolTip. Alternatively, you can take advantage of the following windows, which display variables while debugging:
-
Autos Contains variables referenced on the current or previous line.
-
Locals Contains variables defined in the current method.
-
This Displays the member variables for the current object.
-
Watch Contains variable names that you define while debugging. Up to four Watch windows can be open at one time.
The Autos, Locals, and This windows are automatically populated by the debugger. You can drag and drop variables into a Watch window or add a new variable name by clicking on the first empty line in the window and typing the variable name. To change the value of a variable, simply click the value to be updated and enter the new value.
The current breakpoints for your project can be managed through the Breakpoints window, shown in Figure 9-5. To open this window, choose Windows from the Debug menu and then choose Breakpoints.
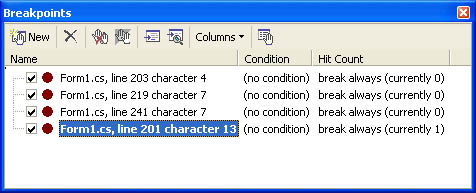 Figure 9-5.
Breakpoints that are enabled appear selected, and disabled breakpoints have an empty check box. The Breakpoints window includes the file name and location for each breakpoint, as well as any breakpoint conditions and the number of times that the breakpoint has been hit.
The breakpoints described in the previous section are known as unconditional breakpoints, which means that the debugger will break whenever they are encountered. The Visual Studio .NET debugger also allows you to set breakpoints that include conditions-if the condition evaluates as true, the debugger will stop at the breakpoint.
Conditional breakpoints are useful when a breakpoint is set in a location that is hit often, but the debugger doesn't need be stopped each time. By setting a breakpoint condition, you can look for a specific test case before stopping execution.
Breakpoint conditions are defined using the Breakpoint Properties dialog box, shown in Figure 9-6. To display the dialog box, right-click a breakpoint in the Breakpoints window, and choose Properties from the shortcut menu.
 Figure 9-6.
Click the Condition button on the File tab to display the Breakpoint Condition dialog box, shown in Figure 9-7.
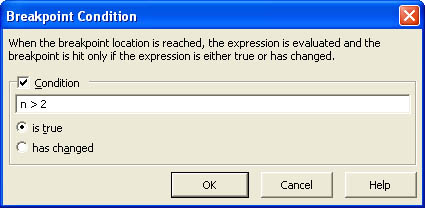 Figure 9-7.
To define an expression to be used as a breakpoint condition, enter an expression in the Condition text box. By default, the breakpoint stops execution if the expression is true. Alternatively, you can elect to have execution stop when the value of the expression changes.
As your code executes, the operating system and CPU maintain a record of the chain of callers that have worked together to cause the current instruction to be executed. This record is stored in a temporary stack data structure known as the call stack that grows and shrinks as your program executes.
The contents of the call stack can be very useful when debugging, because the call stack provides information about the current execution context. Although breakpoints can help you break at a specific location in your code, only the call stack tells you the path taken to arrive at a specific location in your code. If you're currently executing in a method that's called from many locations, the call stack can provide the sequence of methods in the calling chain that were invoked prior to the current method.
When you're debugging, the Debug Location toolbar, shown in Figure 9-8, is displayed by default.
 Figure 9-8.
When you stop at a breakpoint, the contents of the call stack are displayed in the Stack Frame combo box. Selecting an entry from the combo box will navigate to the code location referred to in the call stack.
You can also display the call stack in the Call Stack window, which is opened by choosing Windows from the Debug menu and then choosing Call Stack. The Call Stack window contents are valid only when your program is stopped at a breakpoint, as shown in Figure 9-9.
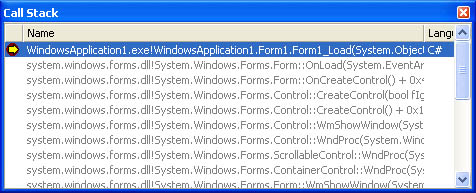 Figure 9-9.


