Performance Fundamentals
The Magic Triangle of Performance
When considering performance and tuning, it is important to understand the performance triangle. The sides of the performance represent: CPU, memory, and I/O (Figure 8.1).
Figure 8.1. The Magic Triangle of Performance.

In an ideal world, the triangle would be an equilateral triangle and would be in perfect balance. While performance tuning on a DB2 UDB server, it is important to consider the trade-offs when making tuning decisions. For example, when tuning sorting within a database, if tuning only for memory and, therefore, reducing the sort heap, we would see an increase in both CPU usage and I/O for the sorting of the data using temporary tables. To attempt to minimize the I/O involved in sorting, the amount of memory assigned to the sort heaps would need to be increased, and this would also lead to increased CPU usage. These three things (CPU, I/O, and memory) must be balanced in order to tune for optimal performance on the database.
Ensure Enough Available Memory
An OLTP workload is much more dependent on memory for performance than a DSS workload; however, both workloads require sufficient memory in order to perform optimally. For OLTP workloads, the memory is normally used for database buffer pools, whereas a DSS workload normally requires much more memory for sorting.
In DB2 UDB Version 8 with full 64-bit support, there are no longer limits on the maximum size of the buffer pools. For an OLTP workload, a good starting point for the initial size of the buffer pool is 75% of the usable memory installed on the database server. For a DSS workload, a starting point for the size of the buffer pools is 50% of the usable memory installed on the server to leave enough memory for application sorting.
In many of today's database servers, a process or thread is dedicated to each client that connects to a database. For a typical OLTP workload that handles large numbers of connected users who perform relatively short-lived transactions with some delay between subsequent transactions, this puts a heavy load on the database server because system resources are being tied up by client connections that are not performing any work. DB2 UDB Version 8 has implemented a connection-multiplexing architecture, the Connection Concentrator, that will allow users to move from a configuration where the number of connected users is constrained by the physical limitations of the underlying hardware to a scenario where the limiting factor will be solely based on the transaction load and the machine's ability to handle such a load.
Ensure Sufficient I/O Handling Capability
No matter what type of disk subsystem is used on the database server, there must be enough physical disks to support a high volume of concurrent transactions for an OLTP system or the large amount of data read for a DSS system. As a general rule of thumb, there should be at least six to ten physical disks per CPU on the database server to ensure adequate throughput and to ensure that there are no bottlenecks.
The best way to estimate the I/O handling capability needed to ensure good performance for the database is to prototype the actual transactions and database to determine the number of I/O requests required per transaction and the number of transactions that will be processed per second. Then the I/O rate for the disk controllers and the disk subsystem can be used to determine how many controllers and disks are required to achieve the desired level of performance.
Use the DB2 Configuration Advisor for an Initial Set of Database Configuration Parameters
The Configuration Advisor will ask a series of questions about the database server, nature of the workload, transactions, priority, connections, and isolation level to determine a starting set of database configuration parameter values. These parameters can later be modified to suit the production workload and for additional fine-tuning.
To configure a database for performance using the Configuration Advisor:
Open the DB2 Control Center.
Select/right-click the database to be configured.
Choose Configuration Advisor.
Complete each of the applicable wizard pages.
Each page is discussed below.
The Finish button is available once enough information has been supplied for the Advisor to configure performance parameters for the database.
Click Finish to get a list of suggested configuration parameters for the database.
Introduction
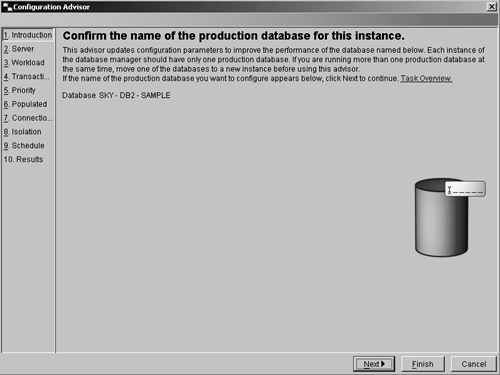
The introduction page shown in Figure 8.2 lists the database that is currently being examined to recommend the configure performance parameters. Verify that the correct database is shown.
Figure 8.2. The Configuration Advisor introduction page.
Server
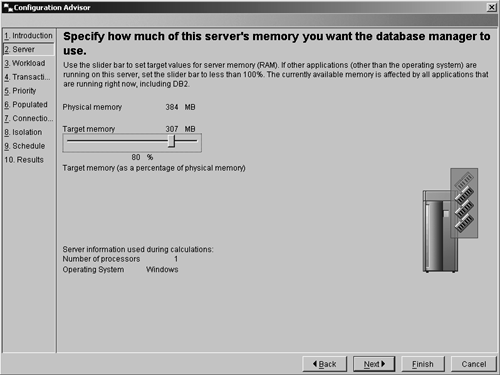
Use the server page shown in Figure 8.3 to specify what percentage of the server's memory is to be used by the database manager. For a dedicated DB2 server, choose 100%; if other applications are also running on the server, set the value to less than 100%.
Figure 8.3. The Configuration Advisor server page.
Workload
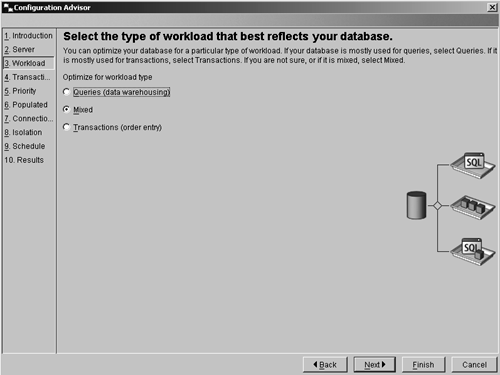
On the workload page shown in Figure 8.4, indicate the type of workload for which the database will be used. Indicate whether the database is used mainly for queries (such as in a data warehousing environment), for transactions (such as order entry), or for a mixed workload (for a combination of queries and transactions).
Figure 8.4. The Configuration Advisor workload.
Transactions
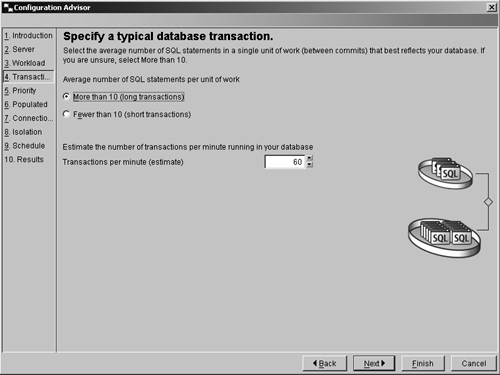
Use the transaction page shown in Figure 8.5 to describe a typical SQL transaction for the database. Indicate whether the average number of SQL statements per transaction is typically less than 10 or more than 10. It is also important to give an indication of the transaction rate for the database.
Figure 8.5. The Configuration Advisor transactions page.
Priority
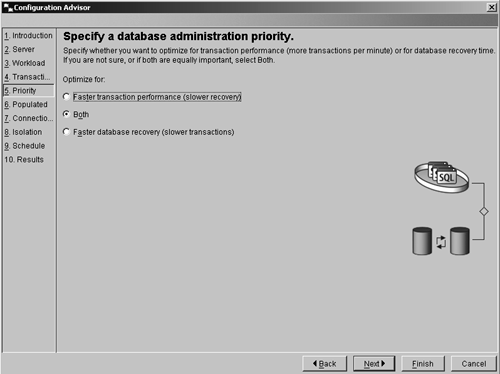
Specify the priority for the selected database on the priority page shown in Figure 8.6. If the database is optimized for fast transaction processing, the database may take longer to recover in the event of an error. If the database is optimized for fast recovery time, transaction performance normally will be slower. If it is equally important to optimize both, choose to balance the optimization of the two.
Figure 8.6. The Configuration Advisor priority page.
NOTE
Use the Performance Monitor and/or Snapshot Monitor to get an accurate measurement of the number of transactions per minute if the database is already operational.
Populated
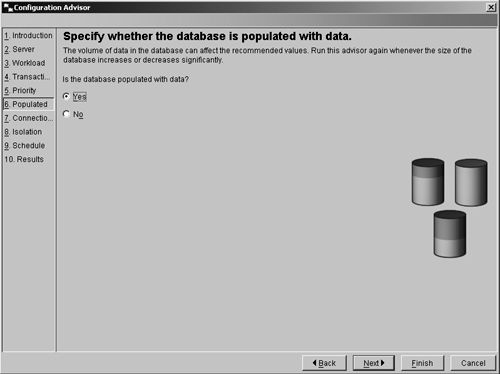
Indicate whether the database has been populated with data on the populated page, shown in Figure 8.7.
Figure 8.7. The Configuration Advisor populated page.
Connections
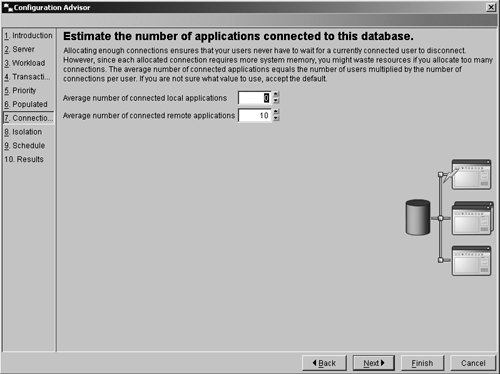
Indicate the average number of local applications and the average number of remote applications that will connect to the database on the Configuration Advisor connections page, shown in Figure 8.8. If these numbers are not available and a good estimate is not available, use the default values.
Figure 8.8. The Configuration Advisor connections page.
NOTE
Use the Performance Monitor to get an accurate measurement of the number of remote and local applications that connect to the database.
Isolation
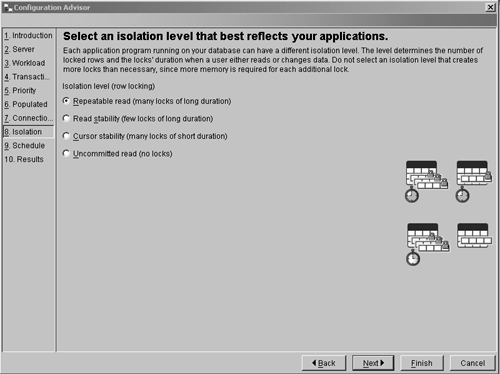
Specify the isolation level that the applications will use to access the database on the isolation page, shown in Figure 8.9. If multiple isolation levels are used, specify the one that is used most frequently in the applications or the one used by the most important application.
Figure 8.9. The Configuration Advisor isolation page.
Schedule
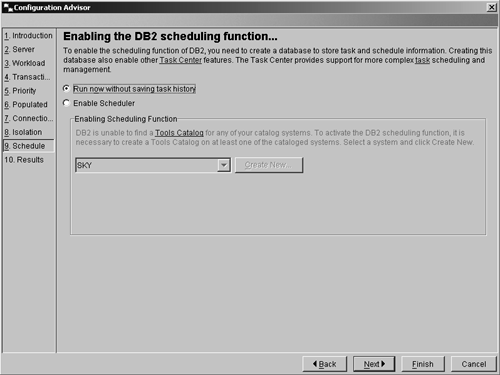
On the Configuration Advisor schedule page (Figure 8.10), specify whether a tools database should be created to store information about scheduled tasks.
Figure 8.10. The Configuration Advisor schedule page.
Results
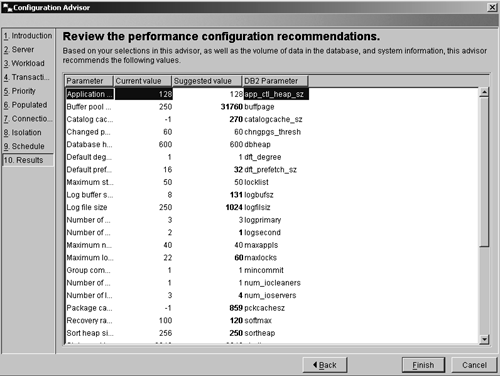
The results page (Figure 8.11) will display the Configuration Advisor's recommended configuration parameter settings, based on the information provided. These settings can be applied immediately or can be saved to a script to be applied at a later time.
Figure 8.11. The Configuration Advisor results page.
Use Proper Indexes
To allow the optimizer to choose efficient access plans that will perform well, it is important to ensure that columns that are frequently accessed with SQL statements containing joins, group by's, or order by's be properly indexed. Columns that are foreign keys for referential constraints should also be indexed. In addition, any column that is accessed frequently should also be indexed, either in a separate index or as an include column on a unique index.
For example, a table (t1) contains columns c1, c2, c3, c4, and c5. If column c1 is unique, but the queries typically always access columns c1 and c2 together, create a unique index (inx1) on column c1 and include column c2. This can be done as follows:
create unique index inx1 on t1 (c1) include (c2)
The Index Advisor (also known as Index wizard from the DB2 Control Center) is a utility that will analyze an SQL statement, or a group of statements, and make suggestions for indexes that could improve the performance of the specified query or queries. If no indexes are currently defined for the table or tables, this would be a good starting set of indexes to use. If there are already existing indexes on the table or tables, the indexes suggested by the Index Advisor should not be blindly added. It is important first to examine existing indexes to determine whether they can be modified (i.e., dropped and re-created with different columns or a different order of the columns), then to create the index if this is not possible.
For an OLTP workload, it is important not to have too many indexes defined because each index adds extra overhead for insert, update, and delete processing. This is not the case in a query-only workload and is the reason that many data warehouses/data marts have much more space used by indexes than by the actual data so that the indexes are available to support any type of query on the system.
Type II indexes provide much better concurrency than type I indexes and should be used wherever possible. Any new tables created with DB2 UDB Version 8 will use type II indexes by default. For a database that was created on a previous version of DB2 and migrated to Version 8, all existing indexes will be type I indexes; however, they can be converted to type II indexes when a table is reorganized. If an existing table already has indexes defined, any new indexes will be created as type I indexes.
Do Not Hold Locks Longer than Absolutely Necessary
Locks should be held only as long as absolutely required. Applications should not be written with a lot of application logic or user interaction required between SQL statements. When an application involves multiple interactions with the database, each database interaction should have its own transaction to commit and should free up all locks before returning activity to the application. Keep the duration of a transaction as short as possible. In addition, because type II indexes allow much better concurrency and help reduce locking, as compared to type I indexes, they should be used whenever possible.
Use Stored Procedures or Compound SQL Whenever Possible for OLTP Systems
Generally, stored procedures should be used when an OLTP transaction has more than four or five statements within a transaction. This helps to minimize the number of network trips required for the transaction and will result in the application holding onto locks and other resources for a shorter period of time.
Use Efficient SQL
In general, don't use multiple SQL statements where one SQL statement will provide the same results. In addition, providing detailed search conditions by specifying more predicates in a query will help the optimizer choose more optimal access plans.
It is also important that the application use queries that do not return more rows and/or columns than necessary. For example, ensure that the SQL statements filter the rows that are needed in the database and do not return every row in the table(s), then expect the application to do the filtering.
Use Parallelism Only When the Workload Requires
For a large, complex query, intra-partition parallelism is good, and the result set can normally be returned much quicker. However, an insert of a single row does not require nine (eight subagents plus the coordinating agent) agents. In a typical OLTP environment, there are normally hundreds (if not more) of applications running in parallel. If each of them were assigned nine agent processes to handle their simple tasks, there would be far too many agent processes running on the system, causing a great deal more system overhead than is required.
Ensure Current Catalog Statistics
The DB2 UDB optimizer relies heavily on the table and index statistics stored in the database catalogs to estimate the costs for potential access plans and determine the best plan. If these statistics are incorrect or out of date, the optimizer cannot choose an optimal access plan. In extreme cases, we have seen SQL statements that have been optimized and executed with out-of-date statistics take over 45 minutes to complete. After updating the table and index statistics, and reoptimizing the SQL statement, it was able to finish in less than a second. This is a tremendous difference and may not be true for all SQL statements, but it does give an example of how important it really is to ensure that the table and index statistics are current.
Statistics for objects are updated in the system catalog tables only when explicitly requested. There are several ways to update some or all of the statistics:
Using the RUNSTATS (run statistics) utility
Using LOAD, with the statistics collection option specified
Coding SQL UPDATE statements against a set of predefined catalog views
Using the REORGCHK UPDATE STATISTICS command
The RUNSTATS utility analyzes the specified tables and indexes, and calculates statistical information that is then stored in the system catalog tables to be used when optimizing SQL statements. The RUNSTATS utility should be run to calculate and capture new statistics under the following conditions:
When a table is loaded with data, and the appropriate indexes have been defined
When a table has been reorganized using the REORG utility
When there have been extensive updates, deletions, or insertions that affect a table and its indexes
"Extensive" typically means that 10?20% of the data in the table has changed
When the prefetch size for a table space is changed
When the REDISTRIBUTE DATABASE PARTITION GROUP command is run
When optimizing SQL queries, the decisions made by the SQL compiler are heavily influenced by the optimizer's model of the tables and indexes referenced in the statement. This model is used by the optimizer to estimate the cost of a set of potential access paths that can be used to resolve the particular query. A key element in the data model is the set of statistics gathered about the data contained in the database and stored in the system catalog tables. This includes statistics for tables, nicknames, indexes, columns, and user-defined functions (UDFs). A change in the data statistics can result in a change in the access plan selected as the most efficient method of accessing the desired data.
Examples of the statistics available that help define the data model to the optimizer include:
The number of pages in a table and the number of pages that contain data
The number of rows in a table
Statistics about individual columns, such as the number of distinct values in a column
The degree to which rows have been moved from their original page to other pages (known as overflow records)
The degree of clustering between the data and the index, i.e., the extent to which the physical sequence of rows in the table follows the indexes defined on the table
Statistics about the index, such as the number of index levels and the number of leaf pages in each index
The number of occurrences of frequently used column values
The distribution of column values across the range of values present in the column
Cost estimates for UDFs
An easy way to determine whether the RUNSTATS utility has been run is to query the system catalog tables. For example:
select stats_time, tbname, nleaf, nlevels, stats_time from syscat.indexes
If the RUNSTATS utility has not been run, the value of "-1" will be stored for the columns nleaf and nlevels in the SYSIBM.SYSINDEXES table. After runstats is run, there will be a value other than "-1" stored for the nleaf and nlevels columns, and the timestamp when the RUNSTATS command was run will be stored for the stats_time column. If the time of the last statistics update is not current, it may be a good idea to run the RUNSTATS command for the tables and indexes.


