SmartView Status
SmartView Status, also known as the Status Manager in FireWall-1 NG FP2 and earlier, allows you to see the current state of all your Check Point modules. In FireWall-1 4.1, this application was called the System Status Manager and only told you about the firewall. Now the application tells you about any Check Point product running on the platform and gives a great deal more information about what is running. Figure 5.1 shows an example of Status Manager on one of my boxes. Though it is from a FireWall-1 NG FP2 installation, it shows the same information and looks the same as SmartView Status in NG FP3 and above.
Figure 5.1. System Status for Craig
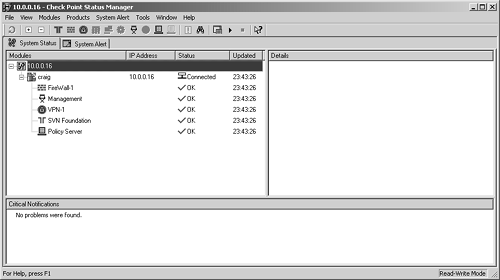
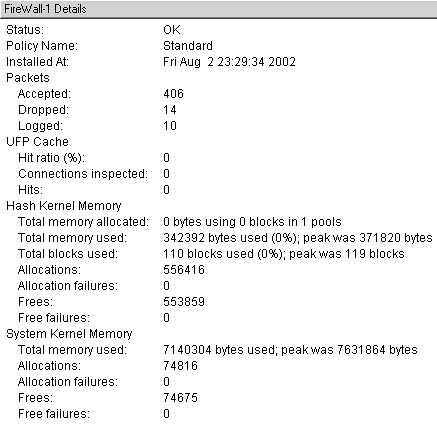
You can click on individual installed components and get detailed information about that component. For instance, if you click on FireWall-1, you see something like Figure 5.2.
Figure 5.2. System Status, FireWall-1 Details screen
NOTE!
The packet counters are reset at each successful policy installation. |
The Management status tells you whether or not the management software is up, the status of High Availability (if applicable), and which clients are connected. This is shown in Figure 5.3.
Figure 5.3. System Status, Management Details screen
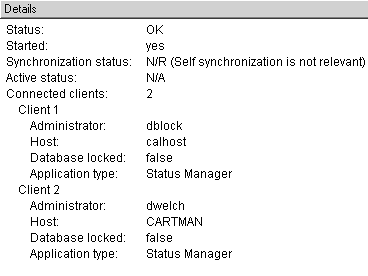
Figure 5.4 shows the status and counters related to the VPN module.
Figure 5.4. System Status, VPN Details screen
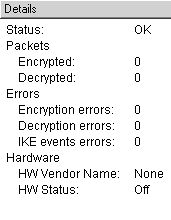
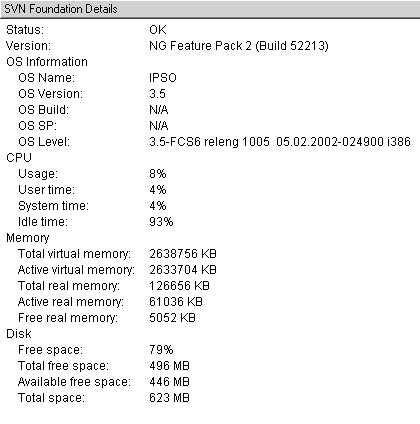
Figure 5.5 shows the status of the SVN Foundation, which includes information about the operating system, memory, and disk utilization.
Figure 5.5. System Status, SVN Foundation Details screen
NOTE!
The disk statistics are relevant only to the drive/partition on which FireWall-1 is installed. On UNIX platforms, including IPSO, this is /opt. |
A module can have four different states (see Table 5.1). An application on a module can have seven different states (see Table 5.2). Specific details regarding failure alerts can be seen in the Critical Notifications portion of the SmartView Status/Status Manager screen.
State | Description |
|---|---|
Waiting | The management console is in the process of establishing a connection to the module. |
Connected | A connection was successfully established to the module. |
Disconnected | The module is not responding to requests for status update. The module might be disconnected from the network, a loaded security policy might be preventing the query, or some other condition might be causing the problem. |
Untrusted | A connection was established to this module, but Secure Internet Communication (SIC) failed to this module. This may be because SIC is not configured on the module, it is out of sync with the management console, or this module is managed by a different management console. |
State | Description |
|---|---|
Waiting | The management console is in the process of establishing a connection to the application. |
OK | A connection was successfully established to the application and everything appears to be functioning normally. |
Unknown | The application is not responding to requests for status update. The module might be disconnected from the network, a loaded security policy might be preventing the query, a Check Point agent is not installed on this module, or some other condition might be causing the problem. |
Untrusted | A connection was established to this module, but Secure Internet Communication (SIC) failed to this module. This may be because SIC is not configured on the module, it is out of sync with the management console, or a different management console manages this module. |
No response | There is no Check Point software installed on this machine, or it is present but corrupted. |
Attention | In a cluster configuration, one or more nodes in the cluster is experiencing a problem. At least one node is functioning correctly, however, and is serving the traffic. |
Problem | The application is responding but is reporting an unusual condition. What this problem is will vary by product. In FireWall-1, for instance, this status can mean that no policy is installed. |
Alerts can be defined for the different applications on your module. After clicking on the System Alert tab, you can set alerts for the different applications. These alerts refer to conditions that might occur on a specific module (e.g., a change in application state, a potential failure condition on the module). Alerts can be defined on a per-module basis or they can be defined globally. If you select your module name on the left of the window, on the right you will see three choices for how System Alerts are defined.
Same as Global: This module will use the Global Alerts settings.
Custom: This module will have uniquely defined alert conditions.
None: This module will not generate any alerts.
Figure 5.6 shows the global alerts you can set for the SVN Foundation application, which are the same as those available on individual modules. The type of alert that will occur, which you can set for each alert condition, is explained later in this chapter.
Figure 5.6. Global System Alert Definition, SVN Foundation tab
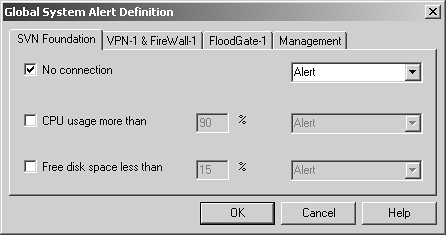
The alerts you can set on the SVN Foundation tab are listed below.
No connection: This refers to losing connectivity to the module.
CPU usage more than: If the CPU utilization on the module goes above the specified percentage, issue the specified alert type.
Free disk space less than: If the available disk space becomes less than the specified percentage, issue the specified alert. Remember that this is only for the drive/partition on which FireWall-1 is installed.
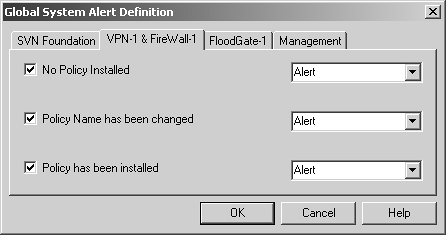
Figure 5.7 shows the global system alerts for VPN-1 and FireWall-1, which also happen to be the same alerts as for FloodGate-1. The alerts are listed below.
No Policy Installed: If the policy becomes uninstalled for any reason, issue the specified alert type.
Policy Name has been changed: If the policy that was previously installed has a different name than the policy just installed, issue the specified alert type.
Policy has been installed: When a policy is installed, issue the specified alert type.
Figure 5.7. Global System Alert Definition, VPN-1 & FireWall-1 tab
The global system alerts for the management module specify an alert only for synchronization. If you are using High Availability for Management Modules and you lose synchronization for any reason, display the appropriate alert.
System Status from the Command Line
If you have command-line access to your management module, you can also get System Status information from the command line. If you are working with remote firewalls, these commands will work only if you have established an authenticated control connection with the remote firewall as described in Chapter 7.
To check the status of the local firewall, use the following command:
# fw stat
HOST      POLICY     DATE
localhost template    21Dec2000 12:59:23 :  [>eth-s1p1c0] [<eth-s1p1c0]
Here's how to look at the status of a remote firewall:
# fw stat mrhat mrtwig
HOST      POLICY    DATE
mrhat     av        21Nov1999 15:23:59 :  [>eth-s1p4c0]
[<eth-s1p4c0] [>eth-s1p1c0] [<eth-s1p1c0] [>eth-s1p3c0]
mrtwig    av        21Nov1999 15:28:17 :  [>eth-s1p4c0]
[<eth-s1p4c0] [>eth-s1p1c0] [<eth-s1p1c0] [>eth-s1p3c0]
This output[1] tells you which policy is loaded (av is loaded on both mrhat and mrtwig), the date the policy was loaded on each box, and which interfaces have seen traffic inbound and outbound. In this example, both firewalls have seen traffic on eth-s1p4c0 and eth-s1p1c0 in both directions. The eth-s1p3c0 interface has seen traffic only in the outbound direction.
[1] Yes, I know this output looks dated, given when this book was written. However, I can assure you the format of the output of these commands hasn't changed in a very long time.
To get more detailed statistics, run fw stat -long:
# fw stat -long mrhat
HOST     IF       POLICY  DATE           TOTAL REJECT  DROP ACCEPT  LOG
mrhat    >eth-s1p4c0 av    21Nov1999 15:23:59  72   0     0    72     1
mrhat    <eth-s1p4c0 av    21Nov1999 15:23:59  57   0     0    57     0
mrhat    >eth-s1p1c0 av    21Nov1999 15:23:59  180  0    14   166     1
mrhat    <eth-s1p1c0 av    21Nov1999 15:23:59  170  0     0   170     0
mrhat    >eth-s1p3c0 av    21Nov1999 15:23:59   90  0    90     0     1
The eth-s1p2c0 interface is missing from this list because it has not seen any traffic. To show this interface, use the -inactive parameter:
# fw stat -long -inactive mrhat
HOST     IF       POLICY  DATE         TOTAL REJECT  DROP ACCEPT  LOG
mrhat   >eth-s1p4c0 av    21Nov1999 15:23:59  72  0     0     72      1
mrhat   <eth-s1p4c0 av    21Nov1999 15:23:59  57  0     0     57      0
mrhat   >eth-s1p1c0 av    21Nov1999 15:23:59 184  0    17    167      1
mrhat   <eth-s1p1c0 av    21Nov1999 15:23:59 171  0     0    171      0
mrhat   >eth-s1p2c0 av    21Nov1999 15:23:59   0  0     0      0      0
mrhat   <eth-s1p2c0 av    21Nov1999 15:23:59   0  0     0      0      0
mrhat   >eth-s1p3c0 av    21Nov1999 15:23:59  90  0    90      0      1
mrhat   <eth-s1p3c0 av    21Nov1999 15:23:59   0  0     0      0      0
The preceding examples of monitoring have been present in FireWall-1 since at least version 2.1. cpstat allows you to check on the status of various modules within the Check Point suite and also gives you the ability to monitor various parts of the operating system, giving you far more details than in previous versions. The usage for cpstat is:
cpstat [-h host][-p port][-f flavour][-o polling [-c count]
       [-e period]] [-d] application_flag
The flags for cpstat are described in more detail in Table 5.3. The applications you can query with cpstat are listed in Table 5.4. The flavors for os, fw, and vpn are specified in Tables 5.5, 5.6, and 5.7, respectively.
Flag | Description |
|---|---|
-h host | Specifies a resolvable hostname, dotted notation IP address, or Dynamic IP hostname. The default, if none specified, is localhost. |
-p port | Specifies which port to connect to if you are running the AMON process on a different port. The default is port 18192. |
-f flavor[a] | Specifies which "flavor" of the particular type of application you want to look in. These are specified by application type in Table 5.4. The default is to use the first flavor listed in the configuration file for that module, which is a .cps file in the module's conf directory ($FWDIR/conf for FireWall-1 related modules, $CPDIR/conf for modules associated with SVN Foundation, and $FGDIR/conf for FloodGate-related modules). |
-0 interval | Specifies the number of seconds between polls of the specified module. The default is 0, meaning show the results only once. |
-c count | Specifies the number of times to poll the specified module. The default is 0, meaning poll only once. |
-e period | Specifies the amount of time over which statistical counters are computed. This is ignored for other types of counters. |
-d | Enables debugging, which is useful for troubleshooting why the command might have failed. |
application_flag | Specifies which application to query (see Table 5.4). |
[a] In English-speaking countries, it's -f flavour. In American-speaking countries, it's -f flavor. Israel is an English-speaking country, despite strong ties to the United States.
Application | Description |
|---|---|
os | Parameters specific to the operating system. Flavors are specified in Table 5.5. |
persistency | A parameter specific to application persistence, i.e., whether or not the application will automatically start on reboot. |
polsrv | Parameters specific to Policy Server. The default flavor shows only the number of licensed and connected users. The all flavor shows whether or not the Policy Server is up in addition to the number of users. |
fw | Parameters specific to FireWall-1. Flavors are specified in Table 5.6. |
vpn | Parameters specific to VPN-1. Flavors are specified in Table 5.7. |
ha | Parameters specific to High Availability. The default flavor shows the current state of High Availability. The all flavor shows this in addition to the current state of all modules in the cluster. |
ls | Parameters specific to Load Sharing. |
mg | Parameters specific to Management Module. |
fg | Parameters specific to FloodGate. |
Flavor | Description |
|---|---|
default | Shows SVN Foundation build numbers and OS version/service pack levels |
routing | Shows the routing table on the specified module |
memory | Shows statistics on memory usage, both real and virtual memory |
old_memory | Shows statistics on memory usage, both real and virtual memory at the last policy installation |
cpu | Shows statistics related to CPU utilization, similar to what you might find in a UNIX vmstat |
disk | Shows statistics related to disk usage; only shows partition where SVN Foundation is installed |
perf | Acts as a combination of memory, cpu, and disk |
average_cpu | Shows average CPU utilization |
average_memory | Shows average memory utilization |
statistics | Shows both average_cpu and average_memory |
all | Shows everything about the operating system covered in previous flavors |
Flavor | Description |
|---|---|
default | Shows the policy name, when it was installed, and packet statistics on a per-interface basis |
policy | Same as default, but also shows the number of connections (current and peak) |
totals | Shows the number of total packets accepted, denied, and logged |
hmem | Shows statistics related to halloc memory, i.e., where FireWall-1 state tables are stored |
kmem | Shows statistics related to FireWall-1's use of kernel memory |
inspect | Shows statistics related to FireWall-1's INSPECT engine |
cookies | Shows statistics related to cookie[a] processing |
chains | Shows statistics related to chain processing |
fragments | Shows statistics related to fragmented packet processing |
ufp | Shows URL Filtering Protocol statistics |
http | Shows HTTP Security Server statistics |
ftp | Shows FTP Security Server statistics |
telnet | Shows Telnet Security Server statistics |
rlogin | Shows rlogin Security Server statistics |
smtp | Shows SMTP Security Server statistics |
perf | Shows a listing of counters from hmem, kmem, inspect, cookies, chains, fragments, ufp, http, ftp, telnet, rlogin, and smtp |
all | Shows all flavors |
[a] Note that a cookie in this context is how FireWall-1 represents a packet in a platform-independent manner, not a cookie that you might experience on a Web site or a cookie that a certain blue monster on Sesame Street might like to eat.
Flavor | Description |
|---|---|
product | Shows the version of VPN-1 |
general | Shows basic packet statistics for VPN-1 |
IKE | Shows IKE statistics |
ipsec | Shows IPSec statistics |
fwz | Shows FWZ statistics (obsolete on modules in FireWall-1 NG FP2 and above) |
accelerator | Shows statistics related to the encryption accelerator (Broadcom, Chrysalis) |
nic | Shows statistics related to network interface cards |
all | Shows all information related to the VPN-1 module |


