Metering Positions: Where to Collect Data Records
After deciding how to meter, the next item on the checklist is defining where to position metering devices in the network. Consider the following options for meter positions:
Meter at the edge opposed to the core.
Meter at the network element or end user device.
Leverage integrated agents at network elements or deploy dedicated probes.
Ingress compared to egress collection.
Network Element Versus End Device Collection
Most customers organize their IT operations into different groups. One team is responsible for designing and operating the networking infrastructure, such as routers and switches. A second group takes care of the servers and applications. Yet another group is in charge of security, such as firewalls, intrusion detection systems, and antivirus agents. There are good arguments for running like this, but one limitation is the isolation, which can lead to finger-pointing between the groups during troubleshooting an organization. The proposed solution to overcome these situations is to meter both at the network elements and at the end devices and servers. In most corporations, the network is considered the cause of an outage, unless the network administrator can prove that the network runs fine. You might not like it, but for many network operators this is the usual situation. How can you make the best of it? Become proactive by collecting and publishing network statistics, which documents the availability of your network, overall as well as per network element. Put a system in place that updates these reports regularly. Afterwards, make sure that the other groups become aware of those reports, and educate them to check your website before calling you. You might see miracles happen! A good way to collect these reports is network-centric metering. Identify relevant locations, ideally close to the data center and client locations. If you can proactively monitor the end-to-end connections between the switch at the client location and the central switches in the data center, you reduce the time to troubleshoot during an outage.
Note
If traffic is encrypted before it is transmitted on the network, the network elements can no longer identify details such as applications. This special case requires metering before the encryption device (such as a VPN concentrator or router) or directly at the server or user PC if end-to-end tunnels are established.
The alternative approach to metering at the network element is including end devices in the monitoring process. These can be PCs, servers, organizers, IP phones, and so on. From a user's perspective, including end devices is a direct measurement because it meters exactly the users' experiences, whereas measurement at the network element is indirect. A drawback of installing management agents at PCs and servers, especially in large environments, is the operational burden it creates for the administrator. In addition to the technical challenges, such as dealing with various operating systems, this requires client software distribution programs and the collection of accounting records from the PCs. Do not underestimate the psychological aspect of monitoring user devices; some users feel like Big Brother is watching. An optimized design combines device- and network-centric collection methods by installing special metering software at the servers (instead of the end-user PC) and enabling metering features at the network elements. Table 2-20 summarizes the pros and cons of both approaches. Best practice suggests combining measurements at network elements and the end device to get the best of both worlds.
| Network Element Collection | End Device Collection | |
|---|---|---|
| Advantages | Identifies network performance issues.
Measures network-specific parameters, such as per traffic class (DSCP) or path-specific. Can be deployed without modifying end devices. | Accurately measures the end user experience. Most realistic for application-specific monitoring. |
| Disadvantages | Indirectly measures the user experience. Performance impact at the network element. | End-to-end results are provided without network-specific measurements.
Introduces end-device challenges, such as dealing with different operating systems, inconsistent configurations, and scalability. Intrusive on the desktop. |
Another approach is technology-specific collection, which can directly limit the number of choices. For example, if you need the classification by specific routing information, it can be collected only at the network edge. Alternatively, if you plan VoIP measurement, you need to shift the focus to the end device. These arguments are addressed in the "Technology-Dependent Special Constraints" section.
Edge Versus Core Collection
For measurements where meters are best suited in the network, as opposed to the end devices, it is suggested that you consider the specific location in the network. This leads immediately to the discussion of what types of data are required, because it limits the choices. For instance, if you need the classification per customer, collect at the edge. The same applies if two customers connect at the same PoP and the traffic between the two should be monitored. For core traffic engineering, the best collection place is the core network. When comparing edge and core metering positions, technology dependence is one factor, but business requirements and applications also need to be considered. If you have a choice between edge and core collection, a good starting point is the business requirements, because they provide solid justification for selecting the appropriate technology afterwards. Here are two examples:
If you want to deploy a usage-based billing system for a large, distributed network, chances are high that a collection only at the core devices might not be sufficient. If adjacent remote locations can communicate directly without passing through the core, edge collection is required.
Best practice suggests performing traffic analysis, policing, and metering at edge devices so that core devices can focus on fast forwarding. Sometimes this rule cannot be applied: in case of a traffic engineering application for the core network, the core is the only place to meter.
From a technology perspective, you need to distinguish between active and passive measurements, as defined in the section "Metering Methods: How to Collect Data Records."
Passive measurement records, such as basic SNMP polling of device interface counters and global status information, such as CPU load, can be collected both at the edge and at the core of the network without significant effort, as long as moderate polling rates are configured. Activating NetFlow at the core and edge at the same time is usually not recommended, because it has higher resource consumption than basic SNMP operations and exports a larger set of data records to the collector. Instead of putting an extra burden on network elements, links, and collection servers, the better approach is to identify relevant metering positions and limit the collection to these. If you need NetFlow statistics for core monitoring, collect them at the core devices. If you want to monitor SLA agreements with your service provider, measure at the edge devices toward the provider. Also, note that collecting the same data sets at the core and at the edge results in duplicated records, which need to be correlated and de-duplicated afterwards.
RMON and ART MIB also require specific considerations in terms of where to meter. RMON provides general network utilization details, such as traffic patterns, top talkers, and applications in the network. RMON information can be collected both at the core and at the edge. ART MIB separately measures the "flight time" of datagrams through the network and the server processing time and reports both values. This mandates the meter to be as close to the end devices as possible; therefore, place one ART MIB meter close to the server and the other one close to the users. Never place an ART MIB meter in the middle of the network, between the client and the server. You lose the benefit of distinguishing between network delay and device processing time, because in this case the results are a mixture of network and server response times. Figure 2-17 identifies strategic locations for various metering techniques. In this scenario, SNMP and NetFlow are used in conjunction. Data sent from the data center or clients toward the core can be metered with SNMP interface counters as well as NetFlow services. Even though SNMP collects only an aggregated view of the NetFlow data records, if you want to measure the total traffic from the edge to the core, both techniques are valid options. For collecting edge traffic, SNMP was selected to meter the total volume of user traffic, and NetFlow was chosen at the core to identify traffic patterns, such as traffic source and destination, which cannot be identified by SNMP counters.
Figure 2-17. Passive Measurement Deployment
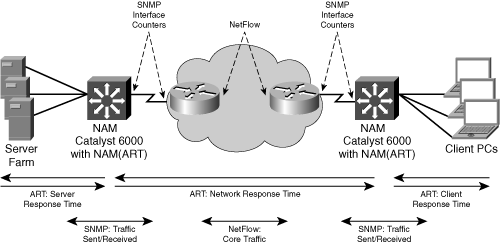
Especially in case of NetFlow deployments, additional factors need to be considered; these are related to Figure 2-18:
Billing— Enable full NetFlow on the aggregation routers to avoid overloading the core network.
Capacity planning— Configure sampled NetFlow on the aggregation or core routers.
BGP— Collect full or sampled NetFlow on the BGP peering routers (usually at the edge of the network).
MPLS VPN— Deploy full or sampled NetFlow for monitoring the MPLS PE-CE links.
Figure 2-18. Passive Measurement Deployment
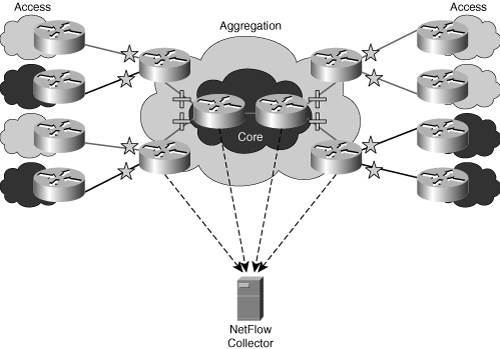
Figure 2-18 also expresses that if you choose edge or core devices for the NetFlow deployment, you should apply the choice consistently to avoid duplicating the flow records. If you enable NetFlow at each aggregation router's ingress interface (marked with a star) and additionally at each core router's ingress interface (marked with a +), it results in a large set of duplicated records. This affects the performance of the network elements, unnecessarily utilizes the network links during export, and increases the performance requirements of the collection server without adding details to the overall collection.
For selecting passive measurement technologies, a business case is also a good starting point, as demonstrated by the following two examples:
A service provider offers different service levels to its customers and wants to measure and publish the results. In this case, the SP meters between different PoPs or from the central network operations center (NOC) to each PoP.
An enterprise wants to check if the existing network is capable of supporting VoIP traffic. The administrator sets up meters close to the user in the central and remote locations and measures the relevant voice metrics, such as jitter.
Figure 2-19 provides examples of active metering locations, using the Cisco IP SLA feature. The shadow router in the PoP is deployed by the provider; it measures SLA parameters between the different PoPs. The edge router at the client locations A and A' measures the SLA parameters and verifies the results. Note that the shadow router in the PoP can also perform tests toward the customer locations, as illustrated for networks C and C'.
Figure 2-19. Active Measurement Deployment
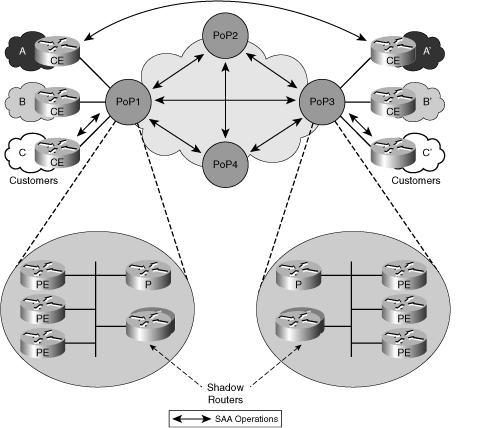
In cases of both active and passive measurement, scalability can become an issue when the networks grow. For passive measurement, the number of data records is a concern. If a single server cannot handle the total number of data records any longer, or if too much collection traffic is transmitted over the network to the central collector, a distributed design becomes necessary. Remote collectors can filter and aggregate the data records and transmit them to the central collector in a compressed format. For active measurement in large environments, the number of operations rises above scalability, especially if you want to measure response time between all locations (CE) in a full-mesh design. The number of operations for a full-mesh collection increases exponentially, as explained in Table 2-21. Because CE-to-CE measurement does not scale, best practice suggests PoP-to-PoP (PE-to-PE) monitoring; in this case, scalability can be improved by deploying IP SLA "shadow" routers in each PoP. As the name implies, the router is almost invisible to the network, because it exists only for measurement purposes. A shadow router is deployed only for IP SLA measurement, and it can be very efficient. In addition to the PoP-to-PoP measurement, PoP-to-CE operations can be defined for all remote locations. This doesn't provide a direct measurement between remote sites but is a good starting point to identify critical performance situations on the network.
| Number of Nodes | Number of Probe Operations, Determined by the Formula n(n – 1)/2 |
|---|---|
| 2 | 1 |
| 3 | 3 |
| 4 | 6 |
| 5 | 10 |
| 6 | 15 |
| ... | ... |
| 100 | 4950 |
Note
Measuring all PoPs from one central instance is a single-point-of-failure scenario and is not recommended. Instead, deploy two central metering devices and share the workload among them. In this case, an outage affects only half the network.
Embedded Versus External Device Collection
When selecting between integrated agents and dedicated metering devices, you notice that there are good arguments for both approaches. It is not simply a question of which one is better, but of what is the right approach for a certain situation. Some scenarios are described in more detail.
A network operator needs to collect usage information for performance trend analysis, troubleshooting, and long-term planning. By leveraging integrated meters at network elements, the operator can deploy the metering quickly, without a massive rollout of dedicated metering devices and making use of existing NMS applications for configuration, software image management, and inventory management. All of those functions are additional requirements when deploying dedicated metering devices. The advantages of a fast and easy deployment vote for integrated agents. But there are also good arguments against them, such as additional resource consumption, plus the fact that network elements are not designed to collect a large number of accounting and performance records.
Technology sometimes reduces the flexibility to choose between integrated network element functionality and external devices. If the application requires "BGP next hop" as a data type, this can be metered only by an internal agent at the network element.
Another scenario is the metering of details, such as application response time, volume of traffic per application, and capturing packets for troubleshooting. In this case, the operator could use integrated RMON groups at network elements. To balance resource consumption, Cisco routers implement only the RMON alarm and event groups (a group in this sense can be considered a subset of a MIB), whereas Cisco switches support the statistics and history groups in addition to the alarm and event groups. Due to the performance requirements of RMON and the ART MIB, a full deployment of both technologies is exclusive to dedicated RMON probes, which can be standalone devices or integrated blades such as the Cisco Network Analysis Module (NAM). The penalty for analyzing the RMON2 data would be such for a router that the traffic throughput would suffer. The NAM can be considered a hybrid device, because it has its own processing power, memory, and communication interfaces but is deployed in a slot of a modular switch or router. Dedicated devices are designed solely for network monitoring and can do so very efficiently, without other simultaneous processes interrupting the metering, such as routing, packet forwarding, and others. External devices offer troubleshooting flexibility of being connected to different devices at different locations, which is a cost-efficient way of troubleshooting. External devices can be connected directly to the network by using a splitter or TAP to insert the device into the active link. Alternatively, they can connect to a mirror port (also called a SPAN port) of a switch, which builds on port copy functionality at the switch. Limitations on external devices are the deployment overhead, if ubiquitous monitoring is required and the price of a large number of high-speed interfaces is metered, such as in a WAN environment where all links should be monitored directly and not through mirroring. Note that a mirroring port can support only half-duplex connections, because the measured traffic flows unidirectionally from the switch to the probe. This can cause the dropping of monitoring packets in a full-duplex environment if the utilization is higher than half-duplex speed. If possible, the mirroring port should have a higher interface speed than mirrored ports. As discussed earlier, dedicated metering devices cannot analyze traffic in encrypted tunnels or network-based VPNs. In those scenarios, traffic needs to be metered at or behind the VPN concentrator.
Mirroring traffic to a probe requires fault management to identify situations of service disruption. When metering at an integrated agent, the network element identifies a disconnected link or other connectivity issues. A collection device behind a mirroring port does not receive any traffic during an outage. As long as the mirroring network element is operational, the meter connected to it cannot distinguish between a situation where nothing is mirrored due to no live traffic or due to an outage behind or at the network element.
A special case of a dedicated device for active monitoring is the Cisco IP SLA shadow router. Synthetic IP SLA probe operations can be configured by SNMP with the CISCO-RTTMON-MIB. Any SNMP-based performance application can collect the results from the same MIB. The shadow router concept increases flexibility, because it can run the latest and even experimental images to support the newest probe operations without affecting the stability of the production network. Because it is a "real" Cisco router, it can be managed by the existing management applications, such as CiscoWorks, which offer configuration management, IOS software image upgrades, inventory, and so on.
Table 2-22 summarizes the pros and cons of embedded collection versus external device collection.
| Embedded Collection | External Device Collection | |
|---|---|---|
| Advantages | Leverages the existing infrastructure, including the management.
Measures network element-specific parameters, such as BGP next hop. Includes the routing state in the metering, such as ACLs. Measures encrypted traffic if it terminates at the meter. | Network element-independent deployment.
Efficient collection, because the device was designed specifically for metering. Offloads management functionality from the network element. |
| Disadvantages | Performance impact at the network element.The architecture of the network element was not designed for metering purposes. | Deployment and management costs and effort.Cannot monitor encrypted traffic. |
Ingress Versus Egress Collection
Ingress metering accounts for all incoming traffic before any packet operations are performed by the network element, such as ACLs, QoS marking, and policing. In a service provider environment, ingress traffic at the provider edge (PE) router is metered to identify the traffic volume a customer sends toward the carrier. These data records can be taken into account to check the allowed traffic peak and sustain rate toward the SP as well as for usage-based billing. Egress metering collects traffic that a device forwards after performing operations such as queuing, policing, and dropping; this can be used for traffic analysis and usage-based billing. The contract between the customer and the provider defines where the policing and shaping take place.
From an end-to-end network perspective, the choice between ingress and egress collection is not too relevant, because the egress interface of one router is connected via a WAN or LAN link to the ingress interface of the next router. If you want to collect details at the egress interface of one router, and if a specific accounting feature is implemented as ingress only, you can usually collect it at the subsequent router's ingress interface. This does not apply to all situations; therefore, the focus of this section is on the exceptions. Also, note that the concept of ingress or egress metering applies to only some technologies, such as SNMP interface counters (for incoming and outgoing traffic) and Cisco NetFlow (ingress and egress interface), but not to RMON, which meters the traffic per segment. Integrated agents at the device can distinguish between ingress and egress. For an external device that receives traffic via a mirroring port, it does not make sense to distinguish between the two.
Figure 2-20 depicts an enterprise network with a central router that connects users to the Internet. Note that the "Traffic Flow" arrow identifies the direction from source to destination, which is relevant to define ingress and egress interfaces at the router.
Figure 2-20. Ingress and Egress Metering

For the returning traffic, egress becomes ingress and ingress becomes egress. If you only need to measure the traffic that is exchanged externally but do not want any local traffic collected, you would meter at the egress interface only. Alternatively, you can also collect traffic from all nine ingress interfaces, but it is very likely that they also carry local traffic, which needs to be filtered afterwards. In case of NetFlow, this filtering can be applied at the mediation server, while it is impossible to filter SNMP interface counters.
Note
To avoid duplication of records, do not select ingress and egress collection at the same device unless no alternative solution exists.
Flow Destination or Source Lookup
Another relevant concept, closely linked to ingress versus egress collection, is the flow lookup direction. In case of destination-sensitive billing, the user pays according to the distance between source and destination. If the traffic remains local, such as a local VoIP call, the cost of transferring the packet could be neglected; consequently, the service can potentially be offered free of charge. However, if a service is accessed across an expensive WAN link, this traffic should be charged adequately to the user.
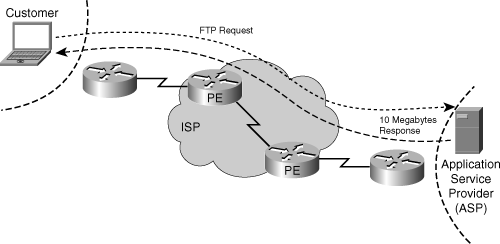
If you consider the destination-sensitive billing model in more detail, you can ask yourself if it is a fair billing scheme. In Figure 2-21, the customer requests a 10-MB file from a remote server. In the case of destination-sensitive billing, he gets charged for only the FTP request (very small). The server's directly connected client (in this case, the ISP) pays to send the 10-MB file. A combination of a destination and source-sensitive billing scheme would be a fair model, because the user now pays for the FTP-REQUEST and the 10-MB file. Consequently, the meters in the ISP network must support destination lookup for the ingress traffic and a source lookup for the egress traffic.
Figure 2-21. Destination-Sensitive Billing Model
Combining the different options results in Table 2-23.
| PE Router | Source Lookup | Destination Lookup |
|---|---|---|
| Ingress interface | Traffic received from an ISP | Traffic received from a customer |
| Egress interface | Traffic sent to a customer | Traffic sent to an ISP |
A common practice in the ISP community is the notion of "hot-potato routing." This basically means that the traffic is routed to the nearest exit point of the ISP network to save bandwidth (and, as a consequence, money) in the ISP core network. However, from an accounting point of view, the traffic's asymmetry characteristic can lead to unexpected results in case of flow source lookup.
As a follow-up to the core traffic matrix example, Figure 2-22 analyzes the source BGP AS.
Figure 2-22. Asymmetric Traffic Constraint

The traffic is initiated in BGP AS 101 and is routed to a destination in BGP AS 104 via BGP AS 102. The return path is different: the alternative path containing AS 105 is used. If router R1 in AS 103 analyzes the neighbor source BGP AS, it executes a lookup in the BGP table with the source IP address of the metered packets. The asymmetric nature of the traffic causes a problem, because the lookup at R1 does not provide the BGP AS from which the packets arrive, but instead the BGP AS that the router would take to reach the packet's source IP address. In the specific situation of Figure 2-22, router R1 assumes that the traffic comes from AS 105 (because R1 would choose this path to get to AS 101), while the user traffic actually comes from AS 102. A possible solution in this case is to meter at multiple points in the network and perform a sanity check afterwards.
Technology-Dependent Special Constraints
In some scenarios, the deployed technology demands where to collect performance and accounting records. In a dial-up environment, the NAS accepts the user authentication and verifies the credentials against the user records at the AAA server. The NAS also generates a RADIUS accounting start record after successful user authentication and a RADIUS stop record when the user terminates the session. As the AAA server identifies the user during the authentication phase, the services accessed during the session can be directly linked to the user's account and turned into an invoice by the billing application. In this case, the meter position is in the NAS.
Consider a different approach. Accounting records are required but no user authentication takes place, which is the case in many enterprise campus networks. If static IP addresses are used, the administrator can create a lookup table that correlates the individual username to the IP address. The billing application can afterwards aggregate accounting records per IP address and substitute the username for the address. Although this method worked well in the past, it does not fit into today's mobile network environments. As an alternative to static address assignment, DHCP assigns IP addresses dynamically to users. In this case, the lookup table approach would not be useful; alternatively, a link between the DHCP server and a DNS server can be established. Now the DNS server creates a dynamic DNS entry per user, based on the computer name (for example, foo) and the domain (research.cisco.com), resulting in a unique user entry (foo.research.cisco.com). The billing application can leverage these records afterwards and assign the utilized network resources to an individual user account. This scenario requires multiple meter placements: at the DHCP server, at the DNS server, and at network devices. The records from these various meters must be correlated by the application in real time to avoid incorrect assignments of users to IP addresses because of the dynamic nature of the DHCP environments.
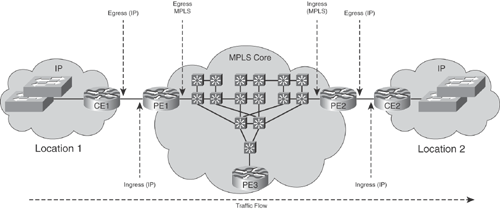
Network protocols provide a different perspective when considering ingress and egress metering. Think about the edge router between the access network and the core network; it runs the IP protocol in the access part and potentially MPLS in the core. Traffic sent from the user toward the core can be collected as ingress IP records or egress MPLS records. The return traffic therefore is MPLS on the ingress interface from the core network and IP on the egress side toward the user. If the accounting application can handle only IP records and not MPLS records, you need to collect ingress traffic from the source toward the core and egress traffic from the destination to the source, all at the same PE device.
Figure 2-23 demonstrates ingress and egress metering from a network element perspective. It represents an MPLS core with multiple VPNs, and accounting per VPN is needed. In this case, accounting records need to be collected at the provider edge (PE) router, where the individual customers are identified by the logical or physical interface that they connect. Ingress accounting in this example provides the traffic generated by the user; a more complex approach is to aggregate per destination address, in case of destination-sensitive billing. At the destination location, egress accounting collects the traffic volume transported through the network. The accounting application can aggregate the PE-PE traffic, consolidate it per customer, and calculate the traffic volume transmitted over the MPLS cloud. Total traffic sent from the source PE minus traffic received at the destination PE equals packet loss in the core network. Figure 2-23 illustrates the different meter positions for this example. The "Traffic Flow" arrow indicates the traffic direction, where location 1 is the source and location 2 the destination. In this scenario, you can meter various details at the different devices and interfaces, as summarized in Table 2-23.
Figure 2-23. Ingress and Egress Metering: Technology-Specific
| Device (Interface) | CE1 (Egress) | PE1 (Ingress) | PE1 (Egress) | PE2 (Ingress) | PE2 (Egress) | CE2 (Ingress) |
|---|---|---|---|---|---|---|
| Meter | Traffic from location 1 to the core | Traffic from location 1 to the core | Traffic toward the core network | Traffic from the core network | Traffic from the core to location 2 | Traffic from the core to location 2 |
| Protocol | IP | IP | MPLS | MPLS | IP | IP |
| Application | Monitoring | Billing | Core traffic matrix | Core traffic matrix | Billing | Monitoring |
| Applied by | Customer (location 1) | Service provider | Service provider | Service provider | Service provider | Customer (location 2) |


