Chapter 5. RMON
After studying this chapter, you have a good understanding of the capabilities of the Remote Monitoring (RMON) series of MIBs. A command-line reference plus SNMP MIB details and configuration examples makes this chapter content quickly applicable.
RMON is a set of standardized MIB variables that monitor networks. All previously defined MIBs monitored only nodes. Even if RMON initially referred to only the RMON MIB, the term RMON now is often used to refer to the concept of remote monitoring and to the entire series of RMON MIB extensions. The standardization of RMON took place at the IETF RMON working group (now concluded), where many activities occurred over the last couple of years. This chapter covers the main RMON achievements in more detail. Four main IETF standard MIBs are mentioned:
RMON 1 and RMON 2 MIBs— Remote Monitoring MIB versions 1 and 2
DSMON MIB— Remote Monitoring MIB Extensions for Differentiated Services
SMON MIB— Remote Network Monitoring MIB Extensions for Switched Networks
APM MIB— Application Performance Measurement MIB
It is important to understand that these are separate MIBs with the purpose of providing in-depth statistics for monitoring certain network environments. They are not special protocols, but MIB extensions that are accessed with SNMP (as described in Chapter 4, "SNMP and MIBs"). Each MIB is explained in detail, followed by Cisco IOS command-line examples in conjunction with SNMP commands (where applicable) to illustrate the two approaches to configuring and monitoring these MIBs.
The initial goal of RMON was to monitor network traffic in a local-area network (LAN) environment and to provide comprehensive information for network fault diagnosis, planning, and performance tuning to network administrators. RMON implements a passive collection approach that measures specific aspects of the traffic without interfering by adding monitoring traffic. RMON can be implemented in network elements, such as Cisco routers and switches, or it can be deployed using dedicated RMON probes. The RMON specifications are quite mature. The first RMON MIB for Ethernet was issued as RFC 1271 in 1991. Later, this specification was superseded by RFC 1757 for SMIv1 and by RFC 2819 for SMIv2. In parallel, the RMON MIB for Token Ring environments was specified in RFC 1513.
Although RMON became successful, implementations made it clear that monitoring on OSI Layer 2 was limited when monitoring wide-area network (WAN) traffic (OSI Layer 3 and above), which led to further extensions, defined by RFC 2021, Remote Network Monitoring Management Information Base Version 2 using SMIv2. RMON version 2 (RMON 2) is an extension to RMON version 1 (RMON 1), which refers to the initial RMON specifications monitoring on OSI Layer 2. RMON 2 focuses on the layers of traffic above the Media Access Control (MAC) layer; the main enhancement of RMON 2 is the capability to measure Layer 3 network traffic and application statistics.
RMON 1 and 2 provide a comprehensive set of monitoring details that requires more resources from the SNMP agent than typical MIBs. To balance monitoring capabilities and resource consumption, the implementation of the groups in this MIB is optional, which means that vendors can select which groups to implement. However, chosen groups must be implemented completely, including all objects of the group. Cisco implements the Alarms and Events groups on all routers and Catalyst switches, which additionally support the Statistics and History groups; the support of these four groups is called "Mini-RMON." Figure 5-1 illustrates the RMON tree, where groups 1 through 10 represent RMON 1 (groups 1 to 9 are for Ethernet, and group 10 is specific to Token Ring) and groups 11 through 20 correspond to RMON 2.
Figure 5-1. RMON MIB Tree
Table 5-1 offers details about RMON 1 groups. Table 5-2 provides additional information about RMON 2 groups, where the extensions mostly concentrate on the higher layers of the protocol stack. More details on Table 5-2 can be found in RFC 3577.
| RMON 1 Group | Function | Elements |
|---|---|---|
| Statistics | Contains statistics measured by the RMON probe for each monitored interface on this device. | Packets dropped, packets sent, bytes sent (octets), broadcast packets, multicast packets, CRC errors, runts, giants, fragments, jabbers, collisions, and counters for packets ranging from 64 to 128, 128 to 256, 256 to 512, 512 to 1024, and 1024 to 1518 bytes. |
| History | Records periodic statistical samples from a network and stores them for later retrieval. | Sample period, number of samples, items sampled. |
| Alarms | Periodically takes statistical samples from variables in the probe and compares them with previously configured thresholds. If the monitored variable crosses a threshold, an event is generated. | Includes the alarm table: alarm type, interval, starting threshold, stop threshold.Note: The Alarms group requires the implementation of the Events group. |
| Hosts | Contains statistics associated with each host discovered on the LAN. | Host MAC address, packets, and bytes received and transmitted, as well as number of broadcast, multicast, and error packets. |
| HostTopN | Prepares tables that describe the hosts that top a list ordered by one of their base statistics over an interval specified by the management station. Thus, these statistics are rate-based. | Statistics, host(s), sample start and stop periods, rate base, and duration. |
| Traffic Matrix | Stores statistics for conversations between sets of two MAC addresses. As the device detects a new conversation, it creates a new entry in its table. | Source and destination MAC address pairs and packets, bytes, and errors for each conversation. |
| Filters | Enables packets to be matched by a filter equation. These matched packets form a data stream that might be captured or that might generate events. | Bit-filter type (mask or not mask), filter expression (bit level), conditional expression (and, or, not) to other filters. |
| Packet Capture | Enables packets to be captured. | Size of buffer for captured packets, full status (alarm), and number of captured packets. |
| Events | Controls the generation and notification of events from this device. | Event type, description, the last time the event was sent. |
| Token Ring | Provides additional statistics for Token Ring networks. | MAC layer statistics, promiscuous statistics, MAC layer history, promiscuous history, ring station order table, alarms, events. |
| RMON 2 Group | Function |
|---|---|
| protocolDir | Lists the protocols supported by the RMON probe. Allows the addition, deletion, and configuration of entries in this list. |
| protocolDist | Shows statistics (number of octets and packets) on a per-protocol basis. |
| addressMap | Lists MAC address to network address bindings and the interface they were last seen on. |
| nlHost | Network Layer Host group. Counts the amount of traffic sent from and to each discovered network address. |
| nlMatrix | Network Layer Matrix group. Counts the amount of traffic sent between each pair of discovered network addresses. |
| alHost | Application Layer Host group. Counts the amount of traffic, per protocol, sent from and to each discovered network address. |
| alMatrix | Application Layer Matrix group. Counts the amount of traffic, per protocol, sent between each pair of discovered network addresses. |
| usrHistory | User History group. Combines mechanisms from the Alarms and History groups to provide history collection based on user-defined criteria. |
| probeConfig | Controls the configuration of RMON features. |
| rmonConformance | Describes conformance requirements. |
From an Accounting and Performance Management perspective, not all 20 groups are equally important. The Alarms and Events groups are mainly used for fault management purposes by defining triggers for rising and falling alarm thresholds. The Statistics and History groups provide valuable input for Performance Management. The application and network layer Host and Matrix groups are relevant for Accounting purposes, because they can identify individual host addresses.
RMON 1 and 2, as defined by RFC 2819 and RFC 2021, respectively, define only 32-bit counters, which is an issue for 100-Mbps and Gigabit ports. RFC 3273, Remote Network Monitoring Management Information Base for High Capacity Networks, also referred to as "HC-RMON," has been updated by RFC 4502, Remote Network Monitoring Management Information Base Version 2. It offers 64-bit counters for each of the tables in the RMON 1, RMON 2, and Token Ring extension MIBs, except for the mediaIndependentTable. RFC 3434, Remote Monitoring MIB Extensions for High Capacity Alarms, specifies managed objects for extending the alarm thresholding capabilities found in RFC 2819 to provide similar threshold monitoring of objects based on the Counter64 data type.
The rmonConformance group was added in RMON 2. Subgroups provide details about the support of RMON 1, RMON 2, SMON, HCMON, etc. This group is very helpful for identifying which specific RMON group is supported by the network elements, because polling it from an NMS station returns the provided functions.
RMON Principles
The principles of RMON are as follows:
It is a set of standardized MIB variables monitoring networks.
It offers information that lets administrators analyze network utilization, including data and error statistics.
RMON 1 includes only data link layer (Layer 2) details.
RMON 2 offers network layer to application layer details (Layer 3 and up).
Collection data is accessible via SNMP, and the initial configuration can be done by CLI or SNMP. To retrieve the collection results via SNMP, you need to enable SNMP on the network element first. When configuring SNMP, distinguish between read-only access and read-write access. For more details about SNMP configuration, see Chapter 4.
The RMON MIBs contain only 32-bit SNMP counters, unless RFC 3273 or RFC 4502 is used.
The MIB objects are intended as an interface between a network agent and a management application; they are not intended for direct manipulation by humans. These functions should be handled by the network management application. This suggestion is generally applicable to all MIB variables mentioned!
Supported Devices and IOS Versions
The following list defines the devices and Cisco IOS Software Releases that support RMON:
RMON was introduced in IOS 11.1.
Polling the probeCapabilities MIB object identifier (OID) (from the probeConfig group) indicates which RMON 1 and 2 groups are supported on at least one interface by this RMON probe.
Full RMON 1 and 2 functionality is supported by external probes, such as the Network Analysis Module (NAM) for the Cisco Catalyst switches, and the branch router series NAM.
Cisco routers support the Alarms and Events groups.
Cisco Catalyst switches support the Alarms, Events, Statistics, and History groups.
A special IOS image is offered for the Cisco 2500 and AS5200 routers to support nine RMON 1 groups for Ethernet interfaces. In IOS 12.0(5)T, the RMON agent for these platforms has been rewritten to improve performance and add new features.
Polling hcRMONCapabilities indicates which High Capacity RMON MIB groups (RFC 3273) are supported on at least one interface by this probe. For example, high-capacity counter extensions for the Ethernet and History groups are included in the Cisco 6000 and 7600.
Cisco routers and switches currently do not support RFC 3434; however, CISCO-HC-ALARM-MIB, which is based on an interim Internet draft, is supported on the MDS 9000.
For up-to-date information, check the Cisco Feature Navigator home page at http://www.cisco.com/go/fn.
Cisco NAM Modules
Because of the extensive CPU and resource impact of full RMON 1 and 2 implementations, Cisco invented a separate monitoring module—the NAM—for the Cisco Catalyst 6500 and 7600 router series. It gives network managers visibility into all layers of network traffic by providing RMON 1 and 2 functions as well as support for SMON, DSMON, HC-RMON, and ART. The NAM adds to the built-in "mini-RMON" features (which support the Alarms, Events, Statistics, and History groups) in Cisco Catalyst 6500 series switches and Cisco 7600 series routers that provide port-level traffic statistics at the MAC or data link layer. The NAM provides functions to analyze traffic flows for applications, hosts, conversations, and network-based services such as quality of service (QoS) and voice over IP (VoIP).
Related to the NAM, Cisco Catalyst switches provide a relevant concept to better leverage the RMON probes and NAM modules, which is the Switched Port Analyzer (SPAN) and Remote SPAN (RSPAN) port concept. The operator can configure any interface to act as a copy port, where selected traffic is transmitted. An external RMON probe can be connected to the SPAN port and therefore receive traffic for in-depth analysis. The source can be any of the following:
A single physical port
Multiple physical ports
A single VLAN
Multiple VLANs
The operator can also define the traffic direction for the copy function:
Received traffic only
Transmitted traffic only
Received and transmitted traffic
An extension to the initial SPAN concept is the RSPAN function at the Catalyst 6500, which enables remote copy functions among different switches to better leverage deployed NAMs. This concept was adopted by the SMON standard in the portCopy function. A later feature is Encapsulated Remote SPAN (ERSPAN), which overcomes the Layer 2 link limitation of RSPAN. ERSPAN can send captured packets with Generic Route Encapsulation (GRE) via a routed network.
Supported MIB groups in NAM software version 3.5 are as follows:
MIB-II (RFC 1213)— All groups except Exterior Gateway Protocol (EGP) and transmission
RMON (RFC 2819)— All groups
RMON 2 (RFC 2021)— All groups
SMON (RFC2613)— DataSourceCaps and smonStats
DSMON (RFC 3287)— All groups
HC-RMON (RFC 3273)— All groups except medialIndependentGroup
Application Response Time (ART)— All groups
To address the need for traffic monitoring in enterprise branch offices, Cisco developed the branch router series NAM for the Cisco 2600XM, Cisco 2691, Cisco 2800, Cisco 3660, Cisco 3700, and Cisco 3800 series access routers. It can be considered a small version of the 6500 NAM, with similar functionality and fewer performance and storage capabilities.
CLI Operations
From an accounting and performance perspective, RMON support at the Cisco routers is of limited use, because they support only the Alarms and Events groups, which mainly address fault management requirements. In addition to the Alarms and Events groups, the Catalyst switches also support the Statistics and History groups, which are relevant for performance management. Therefore, this configuration section covers only the statistics and history RMON functions of a Catalyst switch. Notable commands are as follows:
Switch(config-if)# rmon collection stats index [owner ownername]
enables the RMON 1 Statistics group. The index is any arbitrary number that has not yet been used.
Switch(config-if)# rmon collection history index [buckets bucket-number] [interval seconds] [owner ownername]
enables history collection for the specified number of buckets and time period. The index is any arbitrary number that has not yet been used. Because this index is different from the rmon collection stats index (they come from two different MIB tables), it does not have to contain the same value. However, you should use the same value for both indexes, because it makes troubleshooting easier.
Switch(config-if)# rmon {native | promiscuous}
In native mode, RMON monitors only the packets targeted toward the interface. In promiscuous mode, RMON monitors all packets on the LAN segment.
Note that the syntax is similar for the routers. For more information, refer to the IOS commands rmon collection host and rmon collection matrix.
SNMP Operations
The RMON 1 and 2 MIBs are large and comprehensive, so only the main concepts are described in this section. For further information, refer to SNMP, SNMPv2, SNMPv3, and RMON 1 and 2, Third Edition, by William Stallings (Addison-Wesley Professional, 1998).
RMON Row Concept
Because of the complex nature of the available features in the RMON MIB, most functions need initial parameter configuration before the RMON agent (router, switch, probe, NAM blade) can activate the data collection operation.
Many functional groups in this MIB have one or more control tables to set up control parameters and one or more data tables where the results of the operation are stored. The control tables are typically read-write, and the data tables are typically read-only. Because the parameters in the control table often describe results in the associated data table, many of the parameters can be modified only when the control entry is inactive. Thus, the method for modifying these parameters is first to invalidate the control entry, causing its deletion and the deletion of any associated data entries, and then to create a new control entry with the modified parameters. Deleting the control entry also is a convenient way to reclaim the resources used by the associated data. A similar approach is taken for row creation, suspension, and deletion, as explained in more details next.
In the initial RMON MIB, the EntryStatus textual convention was introduced to provide table entry creation, validation, and deletion. This function then was added to the SNMP framework as the RowStatus textual convention (RFC 2579, Textual Conventions for SMIv2). The RowStatus textual convention is used to define all new tables. The old RMON 1 MIB (RFC 2819) uses EntryStatus, and the new RMON 2 MIB (RFC 2021) uses RowStatus. However, the principles of EntryStatus and RowStatus are exactly the same. The following example from RFC 2579 explains the row concept in detail (see the RFC for the full description in the last line):
RowStatus::= TEXTUAL-CONVENTION
STATUS current
DESCRIPTION
"The status of a table entry..."
The status column has six defined values:
active indicates that the conceptual row is available for use by the managed device.
notInService indicates that the conceptual row exists in the agent but is unavailable for use by the managed device.
notReady indicates that the conceptual row exists in the agent but is missing information it needs to be available for use by the managed device (i.e., one or more required columns in the conceptual row have not been instantiated).
createAndGo is used by a management station that wants to create a new instance of a conceptual row and to have its status automatically set to active, making it available for use by the managed device.
createAndWait is used by a management station that wants to create a new instance of a conceptual row without making it available for use by the managed device.
destroy is used by a management station that wants to delete all the instances associated with an existing conceptual row.
active and notInService are states; values may be read or written.
notReady is also a state that can only be read, not written.
createAndGo, createAndWait, and destroy are actions, which can be written but are never read.
Rows can be created, suspended, and deleted:
Conceptual row creation
There are four potential interactions when creating a conceptual row:
- Selecting an instance identifier that is not in use
- Creating the conceptual row
- Initializing any objects for which the agent does not supply a default
- Making the conceptual row available for use by the managed device
Conceptual row suspension
When a conceptual row is "active," the management station may issue a management protocol set operation that sets the instance of the status column to notInService. If the agent is unwilling to do so, the set operation fails, with an error of wrongValue or inconsistentValue. Otherwise, the conceptual row is taken out of service, and a noError response is returned. It is the responsibility of the DESCRIPTION clause of the status column to indicate under what circumstances the status column should be taken out of service (in order for the value of some other column of the same conceptual row to be modified).
Conceptual row deletion
For deletion of conceptual rows, a management protocol set operation is issued that sets the instance of the status column to destroy. This request may be made regardless of the current value of the status column. It is possible to delete conceptual rows that are either notReady, notInService, or active. If the operation succeeds, all instances associated with the conceptual row are immediately removed.
Operations to Activate the Network Layer Host Group from the RMON 2 MIB
The RMON nlhost group (14) consists of an hlHostControlTable, which is responsible for creating the data table nlhostTable for collection operations afterwards. After the entry in the hostControlTable has been created with createAndGo (or createAndWait followed by "active"), the following parameters need to be set up:
hlHostControlDataSource (source interface)
hlHostControlNlMaxDesiredEntries (number of network layer entries)
hlHostControlAlMaxDesiredEntries (number of application layer entries)
hlHostControlOwner
hlHostControlStatus
After they are set up, the entry can be activated with valid (1). From that point on, the RMON agent starts collecting the statistics in the nlhostTable.
Examples
The following example provides a systematic introduction to configuring and monitoring mini-RMON in the Cisco Catalyst switch. It displays the results for both CLI and SNMP. Because RMON 2 is required for a full collection of all RMON 2 parameters, an additional NAM example is provided afterwards.
Initial Configuration
The following example shows how to configure and monitor the RMON 1 Statistics and History groups on a switch:
switch(config)#int fastethernet 3/41
switch(config-if)#rmon promiscuous
switch(config-if)#rmon collection stats 333 owner me
switch(config-if)#rmon collection history 333 buckets 100 interval 3600 owner me
For configuration details on the Cisco NAM, refer to the online documentation at http://www.cisco.com/go/nam.
Collection Monitoring
switch#show rmon statistics
 Collection 333 on FastEthernet3/41 is active, and owned by me,
 Monitors ifEntry.1.67 which has
Received 3348827 octets, 41749 packets,
34673 broadcast and 6468 multicast packets,
0 undersized and 0 oversized packets,
0 fragments and 0 jabbers,
0 CRC alignment errors and 0 collisions.
# of dropped packet events (due to lack of resources): 0
# of packets received of length (in octets):
 64: 28441, 65-127: 11278, 128-255: 675,
 256-511: 1294, 512-1023: 61, 1024-1518:0
The router is accessed with SNMP2c (SNMP version 2c), the read community string is public, and the SNMP tool net-snmp is used. The snmpwalk for the Statistics group configuration is as follows:
SERVER % snmpwalk -c public -v 2c <switch> etherStatsTable
etherStatsIndex.333 = INTEGER: 333
etherStatsDataSource.333 = OID: RFC1213-MIB::ifIndex.67
etherStatsDropEvents.333 = Counter32: 0
etherStatsOctets.333 = Counter32: 3348827
etherStatsPkts.333 = Counter32: 41749
etherStatsBroadcastPkts.333 = Counter32: 34673
etherStatsMulticastPkts.333 = Counter32: 6468
etherStatsCRCAlignErrors.333 = Counter32: 0
etherStatsUndersizePkts.333 = Counter32: 0
etherStatsOversizePkts.333 = Counter32: 0
etherStatsFragments.333 = Counter32: 0
etherStatsJabbers.333 = Counter32: 0
etherStatsCollisions.333 = Counter32: 0
etherStatsPkts64Octets.333 = Counter32: 28441
etherStatsPkts65to127Octets.333 = Counter32: 11278
etherStatsPkts128to255Octets.333 = Counter32: 675
etherStatsPkts256to511Octets.333 = Counter32: 1294
etherStatsPkts512to1023Octets.333 = Counter32: 61
etherStatsPkts1024to1518Octets.333 = Counter32: 0
etherStatsOwner.333 = STRING: "me"
etherStatsStatus.333 = INTEGER: valid(1)
The snmpwalk of the etherHistoryTable MIB OID returns the same content as show rmon history:
switch#show rmon history
Entry 333 is active, and owned by me
 Monitors ifEntry.1.67 every 3600 second(s)
 Requested # of time intervals, ie buckets, is 100,
  Sample # 2554 began measuring at 6w6d
   Received 642 octets, 6 packets,
   0 broadcast and 6 multicast packets,
   0 undersized and 0 oversized packets,
   0 fragments and 0 jabbers,
   0 CRC alignment errors and 0 collisions.
   # of dropped packet events is 0
   Network utilization is estimated at 0
  Sample # 2555 began measuring at 6w6d
   Received 642 octets, 6 packets,
   0 broadcast and 6 multicast packets,
   0 undersized and 0 oversized packets,
   0 fragments and 0 jabbers,
   0 CRC alignment errors and 0 collisions.
   # of dropped packet events is 0
   Network utilization is estimated at 0
Figure 5-2 graphically illustrates show rmon stats with a report from the NAM.
Figure 5-2. NAM RMON Statistics Example
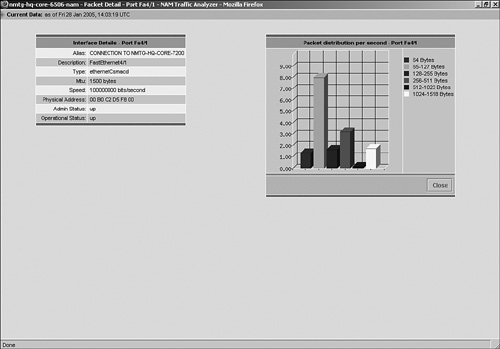
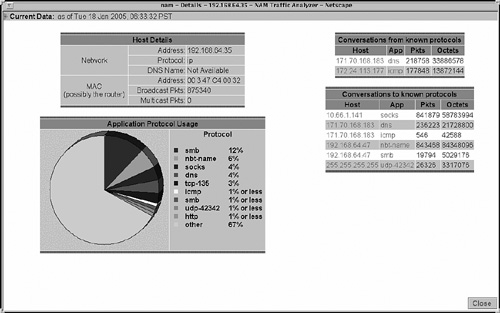
Figure 5-3 is an RMON 2 collection example. You see the RMON probe details in the top left corner. The bottom left part lists the discovered protocols and usage percentage per protocol. The upper right diagram provides received conversation details, separated by hosts, applications, and volume. The lower right covers the same details for traffic generated from this specific host.
Figure 5-3. NAM RMON Host Conversation Example