Operations: How to Measure
Based on the previous suggestions, by now you probably have an idea which performance metrics to start monitoring. Next, you want to identify which IP SLA operation types fit best for a given set of requirements and which parameters to configure.
Operations Parameters
Besides identifying the appropriate IP SLA operations to measure performance metrics, an important step is to define the correct parameters. Is a frequency of 5 minutes accurate enough for the average user's performance requirements? What is the optimal packet size and interpacket interval for a jitter test? There is no perfect answer to these questions, because different services have different requirements. However, some best practices are addressed in the following sections. Figure 11-1 illustrates some of the IP SLA parameters and their relationships.
Figure 11-1. IP SLA Parameters
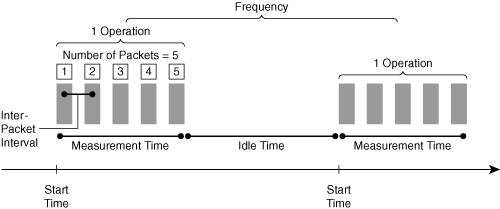
Frequency
Frequency sets the rate at which a specified IP SLA operation is sent to the network. A maximum frequency of one operation per minute and a minimum frequency of one operation every 5 minutes should be sufficient in most networks. The measurement time divided by the measurement interval is called the spectrum of test. For example, running an operation for 30 seconds every minute is equivalent to a 50 percent spectrum of test, because the network is under test 50 percent of the time. The higher the spectrum of test is, the greater the coverage and the larger the amount of test traffic plus performance effect at the source and destination devices. Increasing the frequency also increases the probability of catching an abnormality in the network, but it does not increase the overall accuracy.
Number of Packets
This parameter defines the operation's size. The more test packets an operation generates, the larger the population of measured results becomes. The alternative to running one operation with a large number of packets is to run two or three operations with a smaller number of packets. Because IP SLA aggregates the results per measurement, running more operations with fewer packets increases the granularity over time in comparison to one operation with many packets. Unfortunately, it also means more frequent polling of the device elements to gather results.
Interpacket Interval
The interpacket interval indicates the delay variation between test packets at the receiver side (interpacket delay variance). When a set of packets are generated, they are sent with the same delay value between packets. This delay value changes during the transmission in the network. The receiver calculates the delay variation between packets, resulting in the jitter value. For IP SLA jitter operations, you can define the total number of packets per operation (the default is 10 ms) and the interval between packets (the default is 20 ms). Best practice suggests modeling the desired application's parameters, such as 20 ms in the case of VoIP.
Note that the interpacket interval defines the interval between sending packets within an operation, not the interval between the end of the first transmission and the beginning of the second one.
Packet Size
The main impact of packet size is the device serialization delay, which is relevant for slow network links only. In this case, packet loss can be related to packet size. On fast links, serialization delay can be ignored in comparison to the propagation delay, so the packet size on fast links only consumes bandwidth without adding relevant details.
Timeout
Timeout defines how long an operation waits for the return test packet before considering it lost. This parameter can be used for threshold monitoring. Timeout mainly depends on the measured services and the distance between source and destination. In a LAN environment, a timeout of 5 seconds can be sufficient, whereas monitoring a remote server via a slow link might require timeout values of up to 1 minute.
Lifetime
Lifetime is the total time an operation runs. For SLA validation, lifetime could be configured as "forever." Starting operations during troubleshooting usually limits this value, such as to one hour. Depending on the requirements, a mixture of both ad hoc and scheduled operations might be the right choice.
Start Time
This parameter offers an alternative to running operations forever or just once. You can specify a start time for an operation, let it run for a certain amount of time, and start it again the next day at the same time (recurring function). Note that the start time specifies only the operation's initial start time.
In summary, the selection of operation parameters is a compromise between high measurement accuracy, low bandwidth consumption, and device and network resource usage, such as memory and CPU utilization.
MPLS VPN Awareness
Enhancements to IP SLA allow operators to monitor Multiprotocol Label Switching (MPLS) VPNs and to configure operations on an MPLS VPN PE router by specifying a VPN routing/forwarding (VRF) name to which the operation belongs. The VRF table can be considered a routing table for different VPNs to support overlapping IP addresses in the provider edge (PE) router. If you specify a VRF table when configuring an IP SLA operation, test packets can be sent from one PE to another PE using only the appropriate VPN. The IP SLA Responder is also VRF-aware.
These IP SLA operations can be configured to measure the response time of an MPLS VPN:
ICMP Echo
ICMP Path Echo
UDP Echo
UDP Jitter
UDP Path Jitter
The MPLS VPN-aware operation is supported on Cisco platforms that support multi-VRF or VRF-lite and IP SLA.
IP SLA Responder
Although the IP SLA source device can be considered a "packet generator" for synthetic test traffic within a Cisco network element, the optional receiving component is called IP SLA Responder. This component anticipates and responds to IP SLA request packets and is well embedded in a Cisco network element. Compared to round-trip operations, the IP SLA Responder increases measurement accuracy by time-stamping the test packet as soon as it arrives on the IP SLA Responder, allowing one-way measurements.
To provide useful performance information to an operator, computation of the network response time should distinguish between the "network flight time" and delays introduced by the network elements. Routers may take tens of milliseconds to queue and process incoming packets, which affects the overall response times significantly. The result is that the total response time does not accurately represent the network delay. The IP SLA Responder allows the target device to take a time stamp when the test packet arrives on the ingress interface and another time stamp after processing the request at the Responder.
This allows calculation of the processing time at the receiver. Time stamps offer a granularity of milliseconds for most operation types and microseconds for jitter operations.
Although it is important for troubleshooting to separate network delay and processing delay, for an end-user report they need to be combined, because the user traffic experiences both. A major difference between user traffic and IP SLA synthetic traffic is that IP SLA is implemented as a software process. It does not use the router's forwarding plane (implemented in ASICS), but uses the control plane instead, which is typically slower. Due to the time-stamping at the Responder, subtracting the processing time provides results that are closer to the user experience. Therefore, the distinction between network delay and processing delay is relevant for the Responder!
Figure 11-2 shows how the Responder works.
Figure 11-2. IP SLA Responder Time-Stamping
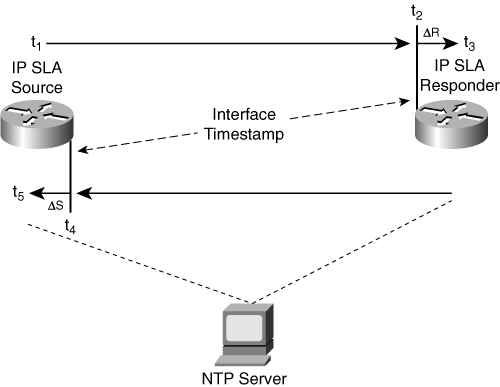
Four time stamps are taken for round-trip time calculation. At the target router (Responder), time stamp 2 (t2) is taken at the ingress interface, and time stamp 3 (t3) is taken after the packet is processed. Time stamps are included in the IP SLA test packet payload. Notice that the same principle is applied on the source router. Time stamp 1 (t1) is applied when the packet is created, and the incoming time stamp 4 (t4) is taken at the interrupt level to increase accuracy. Time stamp 5 (t5) is taken at the IP SLA engine after processing at the source device. Next, the source router subtracts t2 from t3 to construct the Responders packet processing time. This is represented by ΔR = t3 – t2. The same calculation is done for the source device's processing time, where ΔS = t5 – t4. The Δ (delta) values are then subtracted from the overall round-trip time (t5 – t1).
Note that the queuing delay at the source and target router cannot be measured separately. Interface time stamps are applied at the ingress interface only when test packets are received, not at the egress interface before the test packet is sent. Queuing delay can be neglected under normal circumstances; however, this might be an issue on highly utilized interfaces.
An additional benefit of time stamps on the IP SLA Responder is the ability to track one-way delay, jitter, and directional packet loss. Note that for one-way delay measurements the use of Network Time Protocol (NTP), or any time synchronization protocol, is required for both the source router and the Receiver for synchronizing the system clocks. One-way jitter measurements do not require clock synchronization.
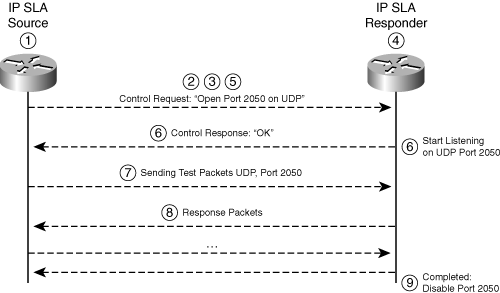
IP SLA can specify the IP address and the port number on which the Responder listens to IP SLA test packets. By not using a fixed port, the network element can avoid denial-of-service (DOS) attacks on well-known ports. However, the IP SLA Responder listens on a specific port number (UDP/1967) for control protocol messages sent by an operation. The control message carries information such as protocol, UDP/TCP port number, and duration of the operation. Upon receipt of the control message, the IP SLA Responder enables the specified port for only the specified duration, accepts the requests, and responds to them. The Responder disables the port after completing an operation or if the duration timer expires. For increased security on IP SLA control messages, you can apply Message Digest 5 (MD5) authentication, which is explained in the "Security" section of this chapter. The IP SLA Responder can reply to multiple operations from multiple sources simultaneously. Using the IP SLA Responder is mandatory for the UDP Jitter operation but is optional for the UDP Echo and TCP Connect operations. ICMP operations do not support the Responder.
The following steps occur for each IP SLA operation that uses the IP SLA Responder:
1. | The source device initiates the operation by specifying a target device, operation, and port number, as defined in the configuration of the IP SLA operations. |
2. | The source device sends a control message to port 1967 of the IP SLA Responder, with the specified port number and duration. |
3. | If MD5 message authentication is enabled, the MD5 checksum is sent with the control message. |
4. | If MD5 message authentication is enabled, the Responder verifies it. If the authentication fails, the Responder returns an authentication failure message. |
5. | If the source device does not receive a reply from the Responder, it retransmits the control message up to three times and eventually times out. |
6. | If the Responder cannot process the control message, it returns an error message. If the Responder successfully processes the control message, it sends an OK reply to the source router and starts listening on the specified port. Note that the Responder can respond to multiple operations from multiple sources that connect to the same port number. |
7. | If the control message's return code is OK, the source device sends IP SLA test packets to the Responder. |
8. | Based on the type of operation, the Responder adds time stamps on the return packets for accurate measurement. The source device performs the computation of response time measurements. |
9. | After responding to the test packets or after the message duration timer expires, the Responder disables the specified monitoring port. |
Figure 11-3 illustrates these steps.
Figure 11-3. IP SLA Responder Communication
Operation Types
Figure 11-4 depicts an overview of the various IP SLA operations.
Figure 11-4. IP SLA Operations
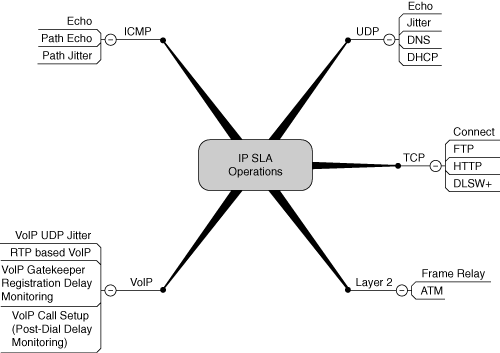
In addition to the structure shown in Figure 11-4, you can apply a different approach when distinguishing the operations:
Responder-based operations offer the capability of unidirectional measurements and improved accuracy compared to round-trip operations. In the replies to the IP SLA source, the Responder includes information about processing delay at the target Cisco device. The IP SLA source device can then separate network delay and destination processing time in its final performance calculation. Use of the Responder is optional for the UDP Echo operation and the TCP Connect operation. It is required for the UDP Jitter, VoIP Jitter, and Frame Relay operations.
Non-IP SLA Responder-based operations are used to monitor specific traffic types, such as HTTP, FTP, DHCP, and TCP Connect. The destination device can be any IP device that supports the protocol being monitored. However, in most cases the targets are not Cisco devices but a server. This explains why those operations are called "non-IP SLA Responders." The most important metric for this group is the server response time, because it reflects the service performance.
The following sections describe all the IP SLA operations in detail. These operations provide a rich set of reports. Some details are generated by all operations, and others are specific. Because the following points are provided by all operations, they are listed only once; the additional details are listed here per operation.
Common operational statistics are
Time and date the operation was modified
Frequency
Remaining active time
Number of operations activated, succeeded, or skipped
Latest operation start time and return code
Threshold counter
Common error statistics are
Number of failed operations due to a connection loss or timeout.
Some operations provide more details about why an operation failed, such as a busy status report when the previously scheduled operation was not finished when the next one was supposed to start.
Some probes report internal errors, such as an authentication failure between the source and destination router if MD5 authentication is applied but fails.
Other internal error types are destination interface down or IP SLA Responder is not enabled (for operations that require the Responder).
Last time the operation was reset: when an operation is reset, all saved statistics are deleted.
ICMP Operations
The Internet Control Message Protocol (ICMP) is also called a "ping test." This is usually the first troubleshooting tool for a network operator to verify connectivity between two points in the network. The destination device can be any IP host. In ICMP operations, the source device sends several ICMP packets to the destination, which echoes the ICMP replies. ICMP operations should mainly be used to verify connectivity and for troubleshooting, because ICMP was not designed as an accurate delay measurement tool. Uncertainties can be caused by low priority processing of ICMP packets in routers, so the absolute delay results might not be representative of the actual packet delay of user traffic.
Note
Note that low-priority processing refers to the router receiving and originating ICMP packets, not to forwarding them. By default, routers forward ICMP packets with the same priority as any other traffic.
In an operational network, administrators usually rate-limit ICMP traffic—in particular, at the provider edge—in an attempt to limit the impact of certain types of DoS attacks. Pinging hosts through long network paths is fine and provides useful results. Pinging routers for accurate results requires knowledge of their configuration—for example, to know if ICMP traffic is rate-limited.
IP SLA supports three different ICMP operations:
ICMP Echo
ICMP Path Echo
ICMP Path Jitter
ICMP Echo Operation
The ICMP Echo operation monitors end-to-end response time between a Cisco router and network elements or IP hosts. Response time is computed by measuring the time between sending an ICMP Echo request message to the destination and receiving an ICMP Echo reply. Because it measures only the packet's complete round-trip time, including the test packet's processing time at the destination, the exact results are of limited value. No general statement can be made if a problem occurred in the network or at the destination host. The ICMP Echo operation conforms to the IETF specifications for ICMP ping tests, and the two methods result in the same response times.
ICMP Echo operation reports include the following additional details: performance statistics, such as number of operations; RTT statistics in milliseconds (latest, average, minimum, maximum); and sum and sum of the squares of the RTT measurements, which is useful in statistical analysis, such as calculating the standard deviation.
ICMP Path Echo Operation
The ICMP Path Echo operation collects statistics for each hop along the path that the IP SLA operation takes to reach its destination. The ICMP Path Echo operation determines this hop-by-hop response time between a Cisco router and any IP device in the network by discovering the path using the traceroute tool. As a result, the round-trip delay for the full path is displayed. If a network has multiple equal-cost paths, it can be useful to measure the response time on a specific path. The strict and loose source routing options in the IP header force ICMP echo packets to follow a particular path. However, this option has some disadvantages. The operator needs to know the topology to be able to set up different paths for the operations, and intermediate hops might not support IP source routing. Furthermore, packets with IP options typically require more processing time per hop, because option processing generally is not part of the optimized data-switching path. This results in an increased response time compared to actual data packets without the option set.
ICMP Path Echo operation reports include the following additional details:
Operational conditions such as target IP address and hop in the path index
Performance statistics are reported as the latest RTT in milliseconds
Error statistics including busy status and internal errors
Default settings for the ICMP Path Echo operation are as follows:
Number of test packets (n) = 10
Interval between sending test packets = 20 ms
Frequency of the operation = once every 60 seconds
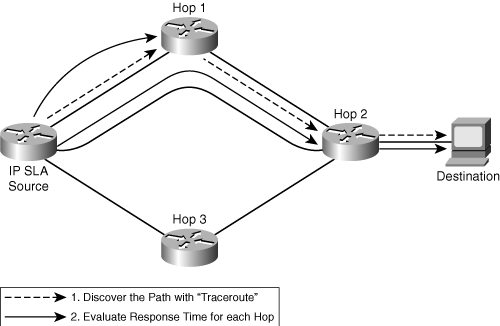
So, by default, every 60 seconds the ICMP Path Echo sends a set of ten test packets separated by 20 ms. Figure 11-5 illustrates the ICMP Path Echo operation. In this case, the default route from the source to the destination host goes via hop 1 and hop 2, so traceroute discovers both hops. A ping (ICMP echo) is then used to measure the response time between the source IP SLA device and each subsequent hop in the path to the destination IP device. If the metrics for the path going through hop 3 should be measured, the source routing IP option must be specified, assuming that this hop supports it.
Figure 11-5. IP SLA ICMP Path Echo Operation
ICMP Path Jitter Operation
The ICMP Path Jitter operation works much like the Path Echo operation. It provides additional metrics, such as hop-by-hop jitter and packet loss. The ICMP Path Jitter operation complements the UDP Jitter operation, which provides total one-way data and total round-trip data. For example, results from the UDP Jitter operation may indicate unexpected delays or high jitter values. The ICMP Path Jitter operation could then be used to troubleshoot the network path and determine if traffic is bottlenecking in a particular segment along the transmission path. First, the operation discovers the hop-by-hop IP route from the source to the destination using traceroute. Then it sends ICMP echo messages to determine the response times, packet loss, and approximate jitter values for each hop along the path. The obtained jitter value for the ICMP Path Jitter operation is the cumulative jitter with noise reduction (RFC 1889).
ICMP Path Jitter operation reports include the following additional details:
- Performance statistics are reported as the latest RTT in milliseconds. The following details are stored per hop:
- Number of successful round-trip measurements
- Sum and sum of the squares of the RTT values in milliseconds
- Minimum and maximum positive and negative jitter and the sum and square sum of these values (in milliseconds)
- Error statistics: number of packets lost; number of packets returned out of sequence; sequence errors, verify errors, or internal errors
Note
The ICMP Path Jitter operation is not supported in the RTTMON MIB; configuration and performance data can be obtained only using the CLI.
Summary of ICMP Operations
In contrast with other IP SLA operations, ICMP operations do not require the IP SLA Responder on either the target device or intermediate devices. ICMP-based operations can compensate for source processing delay but cannot compensate for target processing delay. The jitter values obtained using the ICMP Path Jitter operation are approximate because IP SLA does not use the ICMP TIMESTAMP REQUEST message that allows a responding router to put in receive-time and response-send-time time stamps. If the target router treats ICMP packets with a low priority, it can potentially add significant processing delay. In general, ICMP operations are very good tools for troubleshooting situations. For more robust monitoring and verification, use of the UDP Jitter operation is recommended.
UDP Operations
The results of a UDP Echo operation can be useful for troubleshooting business-critical applications by determining the round-trip delay times and testing connectivity to both Cisco and non-Cisco devices. The round-trip time is computed by measuring the time between sending a UDP Echo request message from the IP SLA source router to the destination device and receiving a UDP Echo reply from the destination device. The source device must be a Cisco router, whereas the destination device can be any IP host.
Compared to ICMP operations, the UDP operations offer more detailed reporting, such as one-way delay measurement, when used in conjuction with the IP SLA Responder.
IP SLA supports three different UDP operations:
UDP Echo
UDP Jitter
VoIP UDP Jitter
UDP Echo Operation
UDP Echo accuracy can be enhanced by optionally using the IP SLA Responder if the destination device is a Cisco network element. The UDP Jitter and VoIP UDP Jitter operations require the IP SLA Responder.
UDP Echo operation reports include the following additional details:
Performance statistics are reported as the latest RTT in milliseconds
Error statistics including the number of corrupted packets; sequence errors, verification errors, or other errors
UDP Jitter Operation
The UDP Jitter operation was primarily designed to diagnose network suitability for real-time traffic applications such as voice, VoIP, or real-time conferencing. However, the IP SLA UDP Jitter operation does more than just monitor jitter, because it also includes the statistics of the UDP Echo operation. The generated UDP test packets carry sending and receiving sequence information as well as sending and receiving time stamps from the source and target.
Default settings for the UDP Jitter operation are as follows:
Number of test packets (n) = 10
Packet payload size (S) = 32 bytes
Interpacket interval = 10 ms
Frequency of the operation = once every 60 seconds
UDP Jitter operation reports include the following performance statistics:
Number of successful round-trip measurements
Number of successful one-way measurements
Sum and sum of the squares of the RTT values in milliseconds
Minimum and maximum positive and negative jitter from source to destination (absolute values in milliseconds)
Number of positive jitter values from source to destination (which means network latency increases for two consecutive test packets) and the sum and the square sum of those positive values (in milliseconds)
Number of negative jitter values from source to destination (which means network latency decreases for two consecutive test packets) and the sum and square sum of those values (in milliseconds)
One-way delay between source and destination or destination and source (in milliseconds)
Minimum and maximum time from the source to the destination and the sum and square sum of these values (in milliseconds)
Error statistics: number of packets lost (from source to destination, or from destination to source, or with an undefined direction); number of packets returned out of sequence; number of packets that arrived after a defined timeout value (late arrival); connection loss; and failed operations due to busy, disconnect, timeout, or other errors.
VoIP UDP Jitter Operation
A VoIP-specific implementation of the UDP Jitter monitoring operation simulates specific voice codecs and calculates voice quality scores. The VoIP UDP Jitter operation uses UDP traffic to generate approximate Voice over IP quality scores. Note that the RTP-based VoIP operation supports Real-time Transport Protocol (RTP). It is explained in detail in the section "RTP-Based VoIP Operation."
The VoIP UDP Jitter operation modifies the UDP Jitter operation by adding the capability to estimate MOS and ICPIF scores in addition to the metrics already gathered by the UDP Jitter operation.
VoIP UDP Jitter operation reports include the following additional details:
Performance statistics are the same as reported by the UDP Jitter operation, with the addition of the ICPIF and MOS scores for the latest/minimum/maximum values
Error statistics: number of corrupted packets, failed operations due to busy, sequence errors, verification errors, or other errors
Note
ICPIF and MOS values provided by the VoIP UDP Jitter operation are estimates and are intended for only relative comparisons. The values may not match values determined by using other measurement methods. Predictions of customer opinion (such as the E-Model transmission rating factor R and derived MOSs) are intended for only transmission planning and analysis purposes. They should not be interpreted as reflecting actual user opinions.
TCP Connect Operation
The TCP Connect operation is useful for measuring the response time of a server running a particular TCP-based application or general connectivity testing for server availability. TCP Connect is used to test virtual circuit availability or application availability by simulating Telnet, FTP, and other types of connections. TCP Connect measures the response time taken to perform a TCP Connect operation between a Cisco router and any IP device. The destination device can be any IP device or an IP SLA Responder. If the destination router is a Cisco router, IP SLA makes a TCP connection to any specified port number. If the destination is not a Cisco IP host, a known destination port number such as 21 for FTP, 23 for Telnet, or 80 for HTTP must be used.
TCP Connect operation reports include the following additional details:
Operational conditions such as memory used (number of octets used) and the latest IP destination address
Performance statistics are reported as the latest RTT in milliseconds
FTP Operation
The FTP operation measures the round-trip time between a Cisco device and an FTP server to retrieve a file. This is the time taken to download the entire file from the source device. Therefore, this operation does not use the IP SLA Responder. The results of an FTP operation to retrieve a large file can be used to determine the network's capacity. However, carrying a significant amount of data traffic can also affect your network's performance. Both active and passive FTP transfer modes are supported, where passive mode is enabled by default. Only the FTP GET (download) operation type is supported.
FTP operation reports include the following additional details:
Operational conditions including the size of the retrieved file (in bytes).
Performance statistics are reported as the latest RTT in milliseconds. For this specific FTP operation, RTT is the total time to complete the FTP transaction.
Error statistics, such as number of failed operations due to disconnect, busy status, sequence errors, verify errors, or internal errors.
DHCP Operation
The Dynamic Host Configuration Protocol (DHCP) operation measures the round-trip time taken to discover a DHCP server and obtain a leased IP address from it. DHCP provides a mechanism for allocating IP addresses dynamically so that addresses can be reused when hosts no longer need them. IP SLA releases the leased IP address immediately after the operation. The DHCP operation has two modes. By default, the DHCP operation sends discovery packets on every available IP interface from the IP SLA source router to identify all DHCP servers in the network. If a specific server is configured, discovery packets are sent to only that DHCP server.
In addition to monitoring DHCP servers, IP SLA can work in conjunction with a DHCP relay agent. A DHCP relay agent is any host that forwards DHCP packets between clients and servers. Relay agents are used to forward requests and replies between clients and servers when they are not on the same physical subnet. Relay agent forwarding is distinct from the normal forwarding of an IP router, where IP packets are switched between networks somewhat transparently. Relay agents receive DHCP messages and then generate a new DHCP message to send out on another interface. The IP SLA DHCP operation contains relay agent option 82, which is inserted by the DHCP relay agent when forwarding client-originated DHCP packets to a DHCP server. The DHCP server echoes the option verbatim to the relay agent in server-to-client replies, and the relay agent strips the option before forwarding the reply to the client.
DHCP operation reports include the following additional details:
Performance statistics are reported as the latest RTT in milliseconds. For this specific DHCP operation, RTT is the total time to obtain an IP address.
Error statistics, such as number of failed operations due to a busy status, no connection to the destination, sequence errors, verify errors, or internal errors.
DNS Operation
The DNS operation measures the amount of time between a request sent to a Domain Name System (DNS) and the received reply. DNS is used to translate names of network nodes into IP addresses and vice versa. This operation is a critical element for determining a network's overall performance, because most IP services heavily depend on DNS name resolution. In most cases, faster DNS lookup times translate to a faster server access experience. The DNS operation queries for an IP address if you specify a hostname or queries for a hostname if you specify an IP address. The connection response time is computed by measuring the difference between the time taken to send a request to the DNS server and the time a reply is received. This operation does not depend on the IP SLA Responder.
DNS operation reports include the following additional details:
Performance statistics are reported as the latest RTT in milliseconds. For this specific DNS operation, the RTT is the total time to obtain a translation from the DNS server.
Error statistics, such as number of failed operations due to disconnect, busy status, no connection to the destination, sequence errors, verify errors, or internal errors.
HTTP Operation
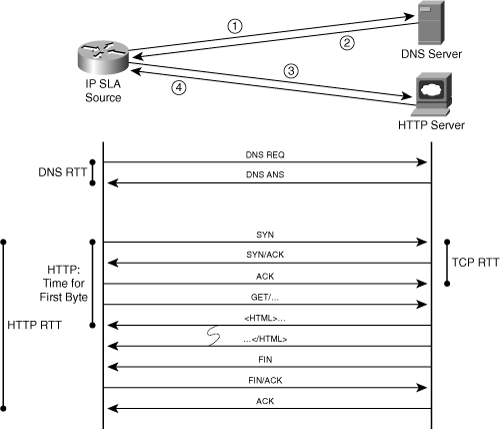
The HTTP operation monitors the response time between an IP SLA source device and an HTTP server to retrieve a web page. The HTTP server response time measurement consists of the sum of three values:
DNS lookup is the RTT taken to perform a Domain Name Server lookup.
TCP Connect is the RTT taken to perform a TCP connection to the HTTP server.
HTTP transaction time is the RTT taken to send a request and get a response from the HTTP server. It is split into the time for the first HTML byte retrieved by the HTTP operation and the RTT to retrieve the full page. Note that images are not downloaded.
An HTTP request can be made through a proxy server. The HTTP operation supports both the normal HTTP GET requests and the customer HTTP raw requests. For HTTP GET, IP SLA formats the request based on the specified URL. For raw requests, IP SLA requires the entire content of the HTTP request. A raw request is more flexible and allows you to control fields such as authentication. Figure 11-6 shows each step of the HTTP operation.
Figure 11-6. HTTP Operation
HTTP operation reports include the following additional details:
- Operational conditions such as the URL of the destination web server, message size of the web page retrieved by the HTTP operation (in bytes), and memory utilized (number of octets)
- Performance statistics, such as RTT (total, minimum, maximum, DNS resolution, TCP connection, HTTP transaction); sum and sum of the squares of the total RTT measurements, all in milliseconds
- Error statistics, such as number of failed HTTP and DNS operations (including authentication failure, or the destination interface is down); number of failed operations due to a DNS, TCP, or HTTP connect timeout; or internal errors, and some diagnosis text
Frame Relay Operation
The IP SLA operation for Frame Relay provides detailed monitoring statistics for physical links or circuits of Frame Relay connections. It provides a variety of metrics for traffic analysis, such as round-trip time, bandwidth usage, throughput, packet loss, burst analysis, delivery ratio, utilization, total frames transmitted, total frames received, and more. The IP SLA function is required on the source device, and the IP SLA Responder at the destination device has to be enabled for Frame Relay. There is no SNMP support for the Frame Relay operations. A vendor-specific XML interface exists; however, specifications currently are not published.
The Frame Relay feature introduces new IP SLA monitoring functions:
Physical Interface— This operation provides physical layer (Layer 1) data for serial interfaces and T3 (DS3) or E3 controllers.
Frame Relay Link— This operation provides Frame Relay link (Layer 2) data for a Frame Relay interface.
Frame Relay Circuit— This operation provides Frame Relay permanent virtual circuit (PVC) data.
The Frame Relay operation uses the enhanced history function, where performance statistics are stored in "buckets" that keep the accumulated data separate from each other. Each bucket consists of data accumulated over a fixed interval of 15 minutes. In the case of the Frame Relay operation, this parameter cannot be configured. Note that there is no SNMP support for this enhanced history function.
Because the Frame Relay operation is testing the connection of a PVC, you do not have to specify an operational target. When specifying the DLCI number, only one target device is possible—the IP SLA Responder.
For the Frame Relay operation, the Responder inserts special frames for statistics measurement. These are returned from the IP SLA Responder to the IP SLA source device.
Frame Relay Monitor operation reports include the following additional details:
Link state of the Frame Relay access channel: up, down, network-down, user-down, or spoof network up/down (the agent has been spoofing for the user over some portion of the sampling interval while the network side of the access channel has been up/down over the entire sampling interval). Also, the number of seconds this circuit has not been available during the current 15-minute interval is reported.
Frame Relay-specific interface performance statistics. These measure the absolute number of frames, not just IP SLA frames.
Maximum and minimum throughput in bps, maximum utilization in percent, maximum number of frames per second per direction (receive, transmit).
Total number of transmitted frames and octets (including error frames) per direction (receive, transmit), depending on the interface speed. These are 64-bit counters.
The number of 1-second intervals in which traffic was detected and the traffic rate was below the configured burst limit.
The total number of frames per direction (receive, transmit) with FCS errors, aborted frames, and too-long or too-short frames; the number of seconds that the network side of the circuit has been down or unavailable; the number of drop events (where a frame was not analyzed and potentially was dropped).
The number of Forward Explicit Congestion Notification (FECN) seconds that occurred for the circuit since it was created. A FECN second is defined as a second during which one or more nonerror frames were received with the FECN bit set.
The number of Backward Explicit Congestion Notification (BECN) seconds that occurred for the circuit since it was created. A BECN second is defined as a second during which one or more nonerror frames were received with the BECN bit set.
The total number of frames and octets transmitted on the circuit that have exceeded the Committed Information Rate (CIR) during the current 15-minute interval.
The number of frames with the Discard Eligible (DE) bit set, per direction (receive, transmit).
IP SLA operations performance metrics include one-way and round-trip measurement. The distribution statistics consist of the sum of completion times (used to calculate the mean), the sum of the completion times squared (used to calculate standard deviation), the maximum and minimum completion times, and the number of completed attempts.
Error statistics, such as number of failed operations due to disconnect, busy status, no connection to the destination, sequence errors, verify errors, or internal errors.
ATM Operation
The IP SLA operation for ATM provides detailed monitoring statistics for physical links or circuits of ATM connections. The ATM interface link statistics are used to monitor the basic health of an ATM interface, such as traffic-, error-, and performance-related counters. The metrics include round-trip time, bandwidth usage, throughput, packet loss, burst analysis, delivery ratio, utilization, total frames transmitted, total frames received, and more. The IP SLA function is required on both the source and the destination device; however, unlike other IP SLA operations, you do not enable the IP SLA Responder at the destination device. Instead, you configure the same ATM operation on both the sending agent and the destination agent to get the full monitoring statistics for ATM connections.
For the ATM operation, the Responder inserts special frames for statistics measurement. These are returned from the IP SLA Responder to the IP SLA source device.
There is no SNMP support for the ATM operations. A vendor-specific XML interface exists; however, specifications currently are not published.
The ATM feature introduces new IP SLA monitoring functions:
Physical Interface— This operation provides physical layer (Layer 1) data for T1 (IMA) interfaces and serial interfaces.
Physical Controller— This operation provides physical layer (Layer 1) data for T1 or E1 controllers configured for ATM.
ATM Link— This operation provides Layer 2 data for an ATM interface.
ATM Circuit— This operation provides ATM PVC data.
The ATM operation uses the enhanced history function, in which performance statistics are stored in "buckets" that keep the accumulated data separate from each other. Each bucket consists of data accumulated over a fixed interval of 15 minutes. In the case of ATM, this parameter cannot be configured.
ATM Monitor operation reports include the following additional details:
ATM-specific interface performance statistics. These measure the absolute number of frames, not just IP SLA frames, and are collected per direction (receive, transmit).
Total number of cells and breakdown in AAL 1, 2, and 5 cells.
Number of Physical Layer Convergence Procedure (PLCP) framing and errors.
Number of corrected and uncorrected cells.
Number of Out of Cell Delineation (OCD) seconds.
Number of Alarm Indication Signal (AIS) seconds.
Number of Remote Defect Indicator (RDI) seconds.
Maximum cells per second.
Number of cell replacement and unanalyzed data events.
Maximum and minimum throughput in bps, maximum utilization in percent, maximum number of frames.
Total number of transmitted frames and octets per direction (receive, transmit).
Five different counters per direction for burst traffic, as a percentage (in seconds).
IP SLA operations performance metrics include one-way and round-trip measurement. The distribution statistics consist of the sum of the completion times (used to calculate the mean), the sum of the completion times squared (used to calculate standard deviation), the maximum and minimum completion times, and the number of completed attempts.
Error statistics, such as number of failed operations due to disconnect, busy status, no connection to the destination, sequence errors, verify errors, or internal errors.
Note
The ATM operation is supported on only the following platforms: Cisco IAD2420 Smart Integrated Access Device (IAD), Cisco 2600 series with T1 or E1 interfaces, Cisco 3660 series with T1 or E1 ATM interfaces, Cisco MC3810 Multiservice Access Concentrators, and Cisco 7200 series.
VoIP Gatekeeper Registration Delay Monitoring Operation
The IP SLA Gatekeeper Registration Delay Monitoring operation provides statistical data on the amount of time taken to register a gateway to a gatekeeper. To measure VoIP gatekeeper registration response time, the IP SLA Gatekeeper Registration Delay operation sends a lightweight Registration Request (RRQ) from an H.323 gateway to an H.323 gatekeeper. It also records the time taken to receive the Registration Confirmation (RCF) from the gatekeeper. The IP SLA VoIP Gatekeeper Registration Delay Monitoring feature focuses on the function of the call control H.323 stack. Statistics include aggregated totals and median or average data; these can be viewed through the command line or SNMP.
VoIP Gatekeeper Registration Delay Monitoring operation reports include performance statistics, which are reported as the latest RTT in milliseconds.
VoIP Call Setup (Post-Dial Delay) Monitoring Operation
The IP SLA VoIP Call Setup (Post-Dial Delay) Monitoring operation measures the response time for setting up a synthetic VoIP call. By supporting H.323 and the Session Initiation Protocol (SIP), this operation measures the total time between an originating gateway sending a call setup message (containing a call number) and receiving a message from the terminating gateway (destination). The trigger for the timer to stop can be configured as the destination to ring or the called party to answer the call.
Before configuring the IP SLA VoIP Call Setup (Post-Dial Delay) Monitoring operation, you need to prepare the source and destination side:
Enable the VoIP test-call application on the originating gateway, which is the IP SLA source router. This application contains the required scripts to generate call messages for H.323 or SIP; the configuration for the call setup operation is essentially the same for both protocols.
An IP phone can be set up at the terminating gateway to respond to the generated test call. A more convenient alternative is to enable the IP SLA VoIP Responder application in the terminating gateway, which responds to incoming call setup messages from the originating gateway using H.323 or SIP. Note that the configuration of the IP SLA VoIP Responder is different from the IP SLA Responder, even though the concept is similar.
Note
If a gatekeeper or dir


