Network Connectivity and Performance
The next question is "How do I check connectivity proactively?" In Figure 13-1, this means ensuring that all locations have access to the data center, can connect to each other, and can reach the Internet. Note the emphasis on "proactively," because it assumes that services in your network are business-critical. As an operator, you are expected to fix issues within defined service contracts, ideally before end users notice anything. Therefore, "proactive" reduces manual troubleshooting with tools such as ping, traceroute, routing table investigation, and built-in web servers at routers to exceptional situations, because they are reactive features. In addition, a proactive tool is required to recognize connectivity problems. The solution of choice is the Cisco IP SLA function, as described in Chapter 11, "IP SLA."
Identifying the network element on which to enable the IP SLA operations in the network depends on the level of monitoring. Simple network connectivity monitoring requires less effort than service monitoring.
Looking at Figure 13-1, valid options are as follows:
Configure an IP SLA operation between each remote location and the central Catalyst to test access to the Data Center LAN. This monitors WAN connectivity only, excluding monitoring of network services.
Configure an IP SLA operation between each remote location and the servers in the Data Center. This measures server availability up to the TCP or UDP port level. It also verifies the servers' return path to the different locations.
Configure an IP SLA operation between each remote location and the Internet access routers.
Knowing that there is VoIP traffic in the network, an IP SLA operation calculating the jitter metric in addition to network delay offers an advantage. Indeed, connectivity, delay, and jitter values can be quantified with a single IP SLA operation.
Because Chapter 11 describes all IP SLA operations, they are not repeated here. The following example displays a typical IP SLA operation for VoIP call monitoring with the following desired parameters:
Jitter operation with a G.711 a-law codec and 1-microsecond precision. Note that the µ-law algorithm is used in North America and Japan, whereas the a-law algorithm is used in Europe and the rest of the world.
Generate a SNMP trap when the connection is lost.
Generate a SNMP trap when the ICPIF value crosses the value of 30,000 in five out of ten operations.
Generate a SNMP trap when the round-trip time crosses 120 ms for three times consecutively.
Router(config)# ip sla 1
Router(config-ip-sla)# udp-jitter 10.10.10.10 16384 codec g711alaw
Router(config-ip-sla-jitter)# precision microseconds
Router(config-ip-sla-jitter)# frequency 30
Router(config-ip-sla-jitter)# exit
Router(config)# ip sla schedule 1 start-time now
Router(config)# ip sla reaction-configuration 1 react connectionLoss threshold-type
immediate action-type trapOnly
Router(config)# ip sla reaction-configuration 1 react icpif threshold-value 30000
30000 threshold-type xOfy 5 10 action-type trapOnly
Router(config)# ip sla reaction-configuration 1 react rtt threshold-value 120 60
threshold-type consecutive 3 action-type trapOnly
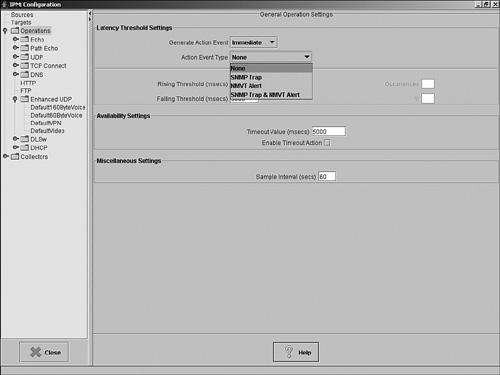
A tool such as CiscoWorks Internetwork Performance Monitor (IPM) supports the configuration of IP SLA operations, as shown in Figures 13-3 and 13-4.
Figure 13-3. Internetwork Performance Monitor: Probe Configuration
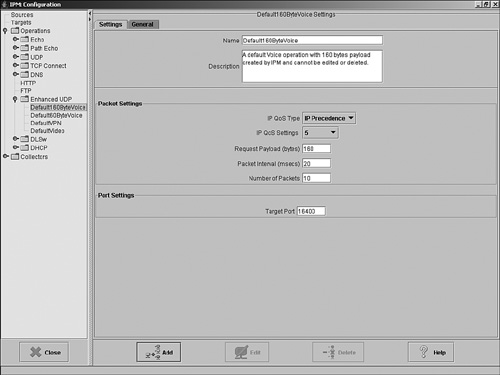
Figure 13-4. Internetwork Performance Monitor: Event Configuration
By retrieving the IP SLA results from the CISCO-RTTMON-MIB (or one of the associated MIBs such as CISCO-RTTMON-ICMP-MIB, CISCO-RTTMON-RTP-MIB, or CISCO-RTTMON-TC-MIB), IPM displays the statistical results on a daily, weekly, and monthly basis. Figure 13-5 shows the average and maximum values of the round-trip time, the jitter in both directions, and the completion of test packets. Other reports display the exceptions compared to predefined thresholds.
Figure 13-5. Internetwork Performance Monitor: Reporting
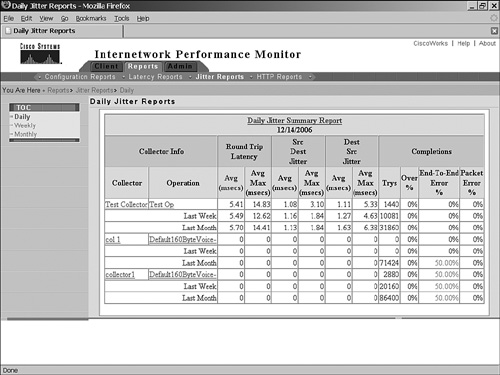
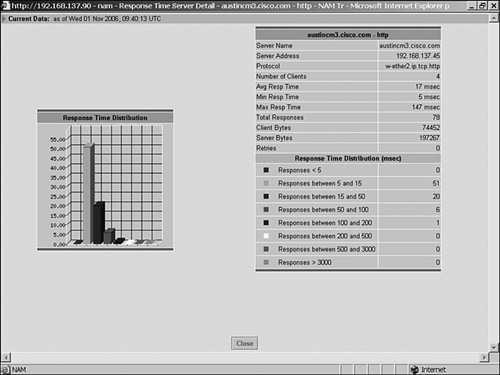
Figure 13-1 shows a Network Analysis Module (NAM) installed at the Catalyst at the Data Center. Because it supports the Application Response Time MIB (ART-MIB), the NAM displays the response time—for example, of TCP connections. Figure 13-6 shows that the average response time for the server is 17 ms, with a minimum of 5 ms and a maximum of 147 ms.
Figure 13-6. NAM Application Response Time Report
The combination of IP SLA and ART-MIB/NAM mechanisms offers a complementary solution in the network blueprint shown in Figure 13-1. Indeed, enabling the IP SLA operations from every location to the central Catalyst quantifies the network delay, the jitter, and the packet loss of synthetic traffic. The NAM measures the server response time of the real TCP traffic.


