Implementing Business Intelligence in SQL Server 2005
|
Microsoft SQL Server 2005 provides a complete set of tools to move data from source systems through to the analysis and then on to the presentation layer. In fact, you can implement a BI system entirely within the toolset that ships with SQL Server 2005 without having to buy anything else. SQL Server 2005 handles source systems for relational OLTP data, SQL Server Integration Services (SSIS) provides the extract, transform, and load (ETL) process from the source system into the ODS or data mart layers, SQL Server Analysis Services (SSAS) serves as an OLAP and data mining engine with multidimensional storage, and SQL Server Reporting Services (SSRS) is a great presentation tool. Using built-in Web technology, you can extend the presentation to an active tool for the users. That is not to say that you should try and do all that on one server. In fact, even a small BI implementation needs a separate server for the three primary parts of the system: the ETL engine and database, the Analysis Services system, and the Reporting Server. In larger situations, you have even more separate servers, based on load. Although it is beyond the scope of this single chapter to detail a large-scale system, you can follow the same process that I explained in Chapter 1, "Installation and Configuration," on sizing a database landscape and the information you find here to create a good BI landscape strategy. Before you begin, you should have a good grasp on all the previous information from this book. The concepts involving sizing, monitoring and optimization, maintenance and security, all the way out to Reporting Services and SSIS are used when you use SQL Server 2005 to create your system. For more information on a particular part of the system, review the chapters that deal with those subjects. SQL Server DatabaseAt many stages of the BI landscape, you can use SQL Server 2005's relational database engine. Your OLTP applications make up the source system data that form the core of the analytical data further down the line. Certain spot measurements that form small parts of your BI implementation are available directly from source systems, so long as they do not place an undue burden on performance. You can also use the database engine store the data for your ODS. This is the near-concurrent data your users need for reporting, so that they do not place an additional load on the OLTP system. Data marts can also be stored this way. Analysis Services, as I explain further, has its own database engine. The demands for processing multidimensional storage differ from those required by relational data processing used by OLTP applications. Although Analysis Services has its own storage, the database that holds the dimensions and facts is a standard relational engine, even if the tables are structured a bit differently. SQL Server 2005 works well for these kinds of tables. Source SystemsMost OLTP applications store their data using a database engine, whether it is SQL Server or some other Relational Database Management System (RDBMS). As you have seen throughout this book, SQL Server 2005 works well in that area. If you are using SQL Server 2005 to implement a BI solution, the advantages go even further, because the source for the BI data is "native" and several wizards within Integration Services and Analysis Services can automatically detect relationships from the database structures and rules it has. That is not to say that you cannot use other systems for your source data, it just means that the SQL Server 2005 systems will work that much better in the landscape. Whether you use SQL Server 2005 or not, the important considerations on the physical plant of the source systems are the extract level and schedule and where you place the logic for the transformations and homogenizations you will need for the next levels in the system. The extract level is the amount of data you will extract from the source system at a single pass. The more data you get, the more locking and other performance considerations you face. Closely tied to that decision is the extract schedule. The more frequent the extraction cycle, the less data you need to get during that cycle. On the other hand, the more frequent the schedule, the more often you interrupt production time. Another important factor to consider is where you transform and homogenize the data. You are eventually going to need the data in the same data type, and by the time it is combined with other systems, it needs to have the same meaning. I personally favor transforming the data as late in the process as possible; in your implementation, however, it may need to be transformed on the way out of the source system. If you need to do that, make sure you logically and even physically separate that process so that you do not adversely affect production. The Operational Data Store and Data MartsThe ODS and the data mart database structures are still relational. That means that both of these layers can be implemented in a standard SQL Server 2005 database. The primary differences in an ODS or data mart database and an OLTP database is that the former are used in a different way. Users in these systems are reporting out of the database, so it has less-constant inserts and more reads. That means that indexes and denormalized tables are more advantageous.
Even though users are not entering data into the ODS or data mart system, it does get loaded periodically. Because the load represents all the changes since the last load, the loads might be adversely affected by a lot of indexes. During the load, it is common to remove the indexes or bypass them and then rebuild the indexes when the load completes. Another difference between this layer and the OLTP source system is that the data can grow quite large in an ODS or data mart layer. In the OLTP system, you store the data once for each row. If that row changes, you only record the end result. In an ODS or data mart, you often store both events. You need to know that you sold two items yesterday and today you adjusted it to three. Because of this historical recording, and because you are integrating several sources systems at this layer, your data will grow, most often by a great deal.
Although this chapter does not deal with BI design, as the database administrator (DBA) you need to consider data archiving at this level. Most of the systems I deal with that are "in trouble" have massive amounts of data and no clear archiving strategy. Online Analytical Processing and Data Mining DatabasesBefore the OLAP system builds multidimensional database aggregations, the data needs to be in a format that allows the system to "pull" the information it needs. The data is stored in a relational database but has a completely different layout from the original data. It is beyond the time we have in this chapter to completely describe how to design these "base" tables, but it is worth understanding what the shape of the data looks like so that you can administer it properly. Earlier I mentioned a spreadsheet with rows and columns that indicated the dimensions of data you are interested in knowing more about. I also mentioned that the numbers inside the spreadsheet are called facts about those dimensions. Those two constructs for the core of what you need to know about the cube origins. In the spreadsheet I mentioned, the data looks like this.
This format also looks like the result from a standard query from a set of relational tables or from a view. To add other dimensions and analyze data from this layout, you need a way to break out the dimensions from the facts. You can do that with a star schema. A star schema is a set of two kinds of tables: dimensions and facts. By using a foreign key in the fact table to a primary key in the dimension tables, you can get the data ready for processing by an OLAP system. Let's add the time dimension to that example to see how a star schema would look for this data. Region Dimension
Product Dimension
Time Dimension
Fact Table
By joining these tables together using the keys, you can see how you can produce the same output as the earlier query and also how you can add other dimensions. In a moment, I explain how Analysis Services uses these tables to create a cube. The star schema can also be extended to include dimensions that point to other dimensions. This is called an extended star schema or sometimes a snowflake schema (from the shape that the tables take). You can use SQL Server's relational engine to store the star or snowflake schemas, as I show you in the example in the "Take Away" section at the end of the chapter. SQL Server Integration ServicesYou can use SSIS as I have already described in two main capacities. The first is to pull data from the source systems into the ODS or data mart layers. The sources can range from almost any relational system such as Oracle or IBM's DB2 all the way to word processing documents, text files, and spreadsheets. The second way you can use SSIS is to put the data into the star or extended star schemas. Of all the tasks in a BI system, this is one of the most tedious processes. Although it is a time-consuming task, it is not that difficult to design. It is a matter of carefully evaluating the source of the data for the star schema and then using SSIS steps to fill out the tables accordingly.
Although I have focused on the star and snowflake schemas in this overview, you do not have to map the tables this way to use them in Analysis Services. In fact, you can map an Analysis Services directly to an OLTP database. Analysis Services differs from other BI solutions in that it focuses on dimensions and facts, not a particular schema. Once again, one of the most important factors is the schedule. You will need to consider the ETL process from the source systems and the creation of the dimensions and facts that form the base of the cubes to ensure that you do not overload one part of the SSIS infrastructure. You may have to use more than one SSIS server, depending on how much data you are trying to integrate. Later in the chapter, I explain how you can use SSIS to process cubes and perform maintenance tasks. SQL Server Analysis ServicesThe heart of the business intelligence system and landscape is SQL Server Analysis Services (SSAS). It provides the OLAP processing and distribution functions as well as the data mining engine and KPI mechanisms. It is simple to create a cube or data mining display using SSAS. If the data is properly structured into dimensions and facts with the proper relationships, just a few clicks creates an entire cube structure. Microsoft includes "Intellicube" technology that determines all the relationships it needs from the fact and dimension tables. SSAS can also create levels of the data such as region, country, and state (called attributes) automatically. It also has a function to create new data by combining columns in a dimension called calculated members. All in all, it has everything you need to take the dimensions and facts and turn them into a BI presentation. Microsoft includes many wizards to help you create these objects. These wizards simplify the process and hide many of the complex underpinnings of the process, but that can be good and bad. It is good because you can quickly assemble a cube or data mining solution quickly, but it is bad because if not designed properly, the information may not be useful. If you have issues later with the design and you have relied on the wizards to create everything, you might not understand how to correct the problem. Because these systems can generate so much processing and storage, you can create an inefficient process quite easily. Fortunately, the wizards in SQL Server 2005 create structures and objects that you can edit later. Even so, you should experiment. This chapter gives you enough background to enable you to be a little more curious and readies you to intelligently read up in other references. Always practice on your test system and do not be afraid to explore. Microsoft has done a great job with the wizards; in large part, they just automate the minutia. When they are done, the model is fully extensible. Business Intelligence Development StudioTo develop your Analysis Services objects, the Business Intelligence Development Studio carries on the same type of development interface you see in Visual Studio or the SQL Server Management Studio. Just like the SQL Server Management Studio, you use this tool to create the content for your system. If you installed Analysis Services, you will find the tool on the Windows Start menu under the Microsoft SQL Server 2005 item. Once you open it, you will see a screen similar to Figure 10-1. Figure 10-1.[View full size image] 
The windows, tabs, and menu items work the same way in this tool as they do in the SQL Server Management Studio; as the name implies, however, the primary use is to develop the BI system. Whereas the Management Studio tool lets you jump right in and create queries, open tables, and generally explore, everything in the Business Intelligence Development Studio requires a project. A project here has the same meaning that it has in Management Studio: It is a collection of connections, databases, and outputs that belong to the same process. You can also use the Business Intelligence Development Studio to create Integration Services and Reporting Services projects as well as database migration and other templates. We will do that in a few moments. In the "Take Away" section, I show you how to create a simple Analysis Services solution. If you have not created an Analysis Services database by the time you review that section, you will not be able to follow along on your system, so I will provide a few more screenshots in this section than normal. Using the Business Intelligence Development Studio, the first place to start is to create a project, as shown in Figure 10-2. This is just a collection of Analysis Services connections and objects that are grouped together. It is similar to creating a project in SQL Server Management Studio, except there it is optional; here it is not. Figure 10-2.[View full size image] 
The first object in a project is a connection to your data. In Analysis Services, this is called a data source. Data sources can connect to everything from SQL Server to Oracle databases, from text files to spreadsheets, and many others. Although the screen looks quite involved, it is a fairly simple process to set up a connection to a source. You can work through an entire example in the "Take Away" section at the end of the chapter. You can create as many connections as you need for a project. The next step is to create a data source view, as shown in Figure 10-3. This is a further refinement of one or more data sources into a single view. It is a logical representation of the data that the Analysis Services database will use. It helps to insulate the users from the structure of the underlying source data. Figure 10-3.[View full size image] 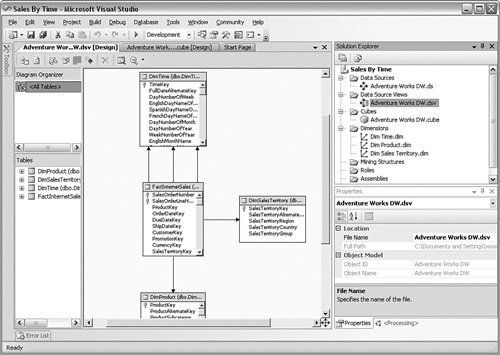
After you have created one or more data source views, you can create a cube. You can create a cube structure by adding in the dimension and fact tables from the star-schema type databases. After you have done that, you can refine the structure by adding hierarchies, calculated members, and other options. Microsoft calls this collection of dimensions, facts, and other elements a Unified Data Model (UDM). The UDM simplifies how the users think about the data. You can see a sample UDM in Figure 10-4. Figure 10-4.[View full size image] 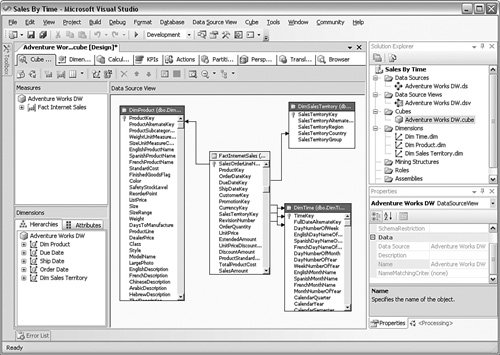
The next step is to create the storage for the OLAP database. You design storage using partitions, which describes the storage type for the database (more on that in a moment) and how many aggregations the engine will process. You can see these choices in Figure 10-5. I cover the choices for storage in the "Management" section a little later in the chapter. Figure 10-5.[View full size image] 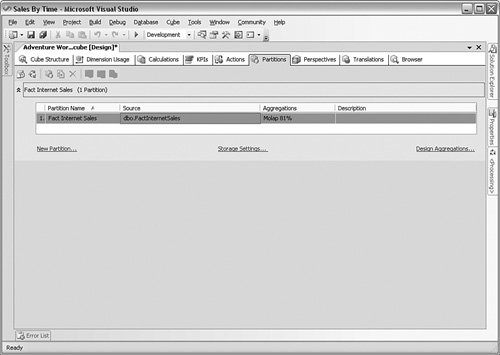
You can create other limitations for the views on the data, called perspectives, shown in Figure 10-6. Perspectives allow you to limit the data based on groups of people that need to see it. After you create the perspectives and make any final refinements, you apply security to the various objects using roles. Figure 10-6.[View full size image] 
With everything defined, refined, and secured, you need to build and deploy the cube and then process it. The building process shown in Figure 10-7 reads the UDM definition, creates the multidimensional database, and calculates the aggregations. Deploying places the solution on the production server and publishes the results for access. Processing fills the aggregation tables with data. I show you an example of that process in a moment. Figure 10-7.[View full size image] 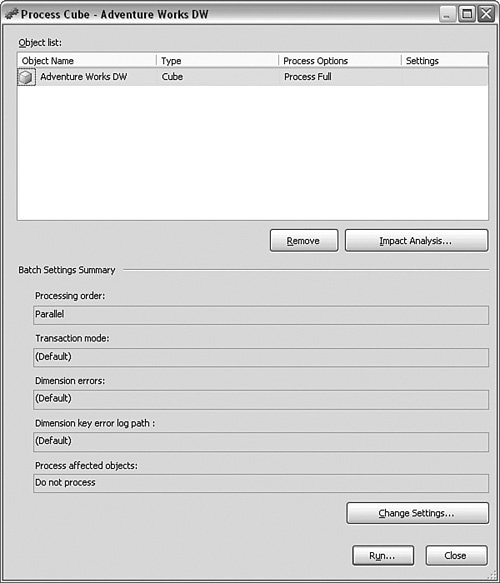
Accessing the SystemAfter the cube has been built, deployed, and processed, you can access it from Analysis Services in one of three ways: inside the Business Intelligence Development Studio, using an application that your developers create, or through a third-party application. Using the Business Intelligence Development Studio is primarily for the designer's review before they release the solution to the users. The last subtab in the Cubes screen allows you to pull the measures (facts) and place them in the center part of the screen. You can drag the dimensions to the top and left side of that panel shown in Figure 10-8 to create a multidimensional view of the data. Figure 10-8.[View full size image] 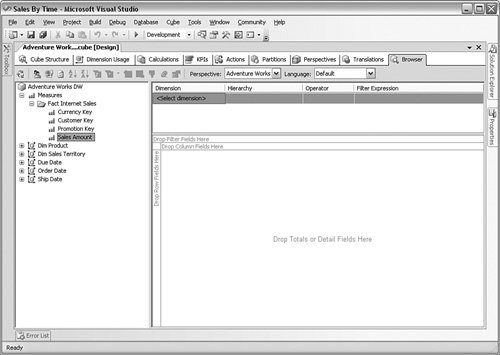
Although this is an easy way to move through the cube and other BI data, you will not install the Business Intelligence Development Studio on every user's system. The end users will access the data using other tools, in what is referred to as the "clicks" paradigm. The clicks paradigm refers to how many clicks it takes a user to receive the BI data. A "0-click" application is where the data finds the user, normally in an e-mail or over a pager. The user does not have to click anything to get the data. In a large organization, this is normally the largest distribution of the data, but it is often tightly targeted. It is usually used for KPIs or a single metric. A "1-click" presentation requires the user to access a static report on the BI data, such as on a portal or corporate share. A "2-click" presentation involves a similar view, but it allows the users to change parameters such as a date range or a region selection. A "3-click" presentation is where a full tool is used. This type of tool, whether locally developed or provided by a third-party vendor, has a "pallet" of the measures and dimensions from the Analysis Services system. It looks similar to the Business Intelligence Development Studio but is for presentation, not design. This is normally reserved for the highest levels of management because it provides a great deal of strategic value and takes a higher level of training to use properly. In all of these presentations, developers can access the data using an application programming interface (API). Query languages are available for cube presentation called multidimensional expressions (MDXs) and for data exploration called data mining expressions (DMXs). You can access an Analysis Services application using an XML implementation called XML for Analysis (XMLA), manage the server using analysis management objects (AMO), and code stored procedures for it using the Common Language Runtime (CLR). As an aside, Microsoft Office products such as Excel also hook into Analysis Services 2005. The list of features and concepts go much further, but this overview explains what you will need to consider as you prepare to manage it. I explain more about that part of the process in the next section. SQL Server Reporting ServicesIn the preceding chapter, I explained how Reporting Services works and its many uses. I mentioned briefly that it provides a great way to view the output from Analysis Services. I also mentioned in the preceding section that you can develop a 1- or 2-click report to show the data from Analysis Services. When you create a report against Analysis Services using Report Services, one of the advantages you have is the variety of outputs you have access to. You can present or export the data to the Web using HTML applications, send it to an image, save it as a PDF file, or send it on to an Excel spreadsheet or comma-separated value (CSV) file. Using a three-step process, you can send the report to a 2-click presentation, out to a 1-click presentation on a Web site or portal, and then on to a 0-click application to other users. Once again, you must consider all the aspects of a BI system for presentation. SQL Server Reporting Services has many wizards that can guide you through creating a report that attaches to Analysis Services, as I demonstrated in the preceding chapter. Each tool should be suited to the presentation the user needs. Reporting Services is a passive viewing method of the data because it does not allow a great deal of control during presentation. In contrast, a 3-click tool is more interactive, allowing the user to move through the data more actively. That is not to say that Reporting Services does not deserve a place in the BI presentation layer, just that it is better suited to static data than interactive mining. I have seen BI implementations grow over time to use hundreds of reports to show the data when a single data browser tool is a better choice. |


