System Optimizations
|
Optimizing a system is one of the most difficult, time-consuming activities you are asked to do, but it is one that if done properly creates the most value in your job. After all, time is money. Because I have separated monitoring from the optimizations, this section defines what you can do after you have discovered the bottleneck. You will find that optimizing a system is often an exercise in moving bottlenecks around. Just like in a crowded city, when you widen a street the next intersection becomes a problem. Fixing that intersection moves the bottleneck two streets over. That is why monitoring and optimizing form a continuous cycle. Do not be surprised to fix one performance issue only to discover that you have hit a different slowdown. Follow the monitoring and optimization process several times, and at some point you will find that you are no longer affecting performance by the changes you are making. At that point, your system is in balance, and beyond a redesign there is not a great deal you can do to make it any faster. All of this changes when a new variable such as new functionality or new hardware is added to the equation. Then you start the whole process over again. PlatformAlthough you will get the most impact from optimizing the application, optimizing the platform is one of the least expensive and most basic things you can do. The optimizations involve the same four parts that are involved in monitoring your system: processor, memory, storage and the network interface. Start with the basics. Monitor the system parts and ensure that it has enough headroom to satisfy the queries as you monitor. Before you add parts to the system, however, ensure that the application is as optimized as possible. It may be that you do not need more processors or memory, just a better-designed query. That is not to say that a little extra hardware is not needed. If you followed the guidelines from Chapters 1 and 2 when you designed the system, you should have what you need, but things always change over time. Monitoring and being familiar with new technologies on the system is required to ensure that you have good performance over the life of the system. It is not only the hardware that needs to be configured. Ensure that the operating system and SQL Server 2005 settings are tuned in accordance with your needs. This involves the SAC tool mentioned earlier as well as the SQL Server Configuration Manager. IndexesMore than almost any other change in a database system, Indexes provide the greatest tuning benefit. There is a balancing act involved with indexes, because you pay for them on a write, but they benefit you greatly during a read. The first set of decisions involves what to index. You need to have indexes that benefit the most reads but not too many that will adversely impact writes. The next decision is what kind of index to use. As I mentioned earlier in the book, you have two types of indexes you can use. The first is the clustered index, which physically orders the table. Because this index places the table data in a certain location on the disk, you can only have one of these. The second type of index is the nonclustered index. This type of index is another object that is similar in structure to the table, containing ranges of data and pointers to their locations. The final decision is when and how to maintain the indexes. If you try to perform your re-indexing operations in the middle of a production cycle, you can expect the system to slow down. If you followed the monitoring guidelines from earlier in the chapter, you will know when your peak activity hours are. If yours is a large shop with complex systems, there may be no downtime available for index and other maintenance. In Chapter 6, "High Availability," I explain how you can balance your maintenance among systems so that you need little or no application downtime. Choosing an Index StrategyChoosing what to index is often left up to the developers. That makes a lot of sense because they are the most familiar with the type of data in the database, and the data access patterns. In complex systems, however, the access patterns are anybody's guess, because they can be used in so many ways. In that case, it is best for the developers to work with the DBAs to find out the patterns. The focus on the data access patterns is important because indexes slow down inserts but speed up reads. By monitoring what the users are doing, you can find out where to place an index. In general, you should place an index on each of the most-often used columns in a query. Create the index with the most restrictive column declared first. This makes the selectivity on the index high, which means that it points to the data the user is asking for quickly. If a column or set of columns is highly sequential and does not have new values inserted earlier in the sequence, you may want to consider a clustered index. Clustered indexes are faster than nonclustered indexes, but you can only have one. A clustered index becomes expensive if the values have to shift around to accommodate inserts at an earlier point. Another consideration is to create a "covering" index. This is not a different kind of index, it just describes an index that contains every column in a query. If a user requests data from a "covered" query, the data is read directly from the index without a trip to the table at all. There are often times when you do not need an index at all. If a table is less than a few thousand rows and you are sure that it will not grow larger than that, you may not need an index. The Query Optimizer will look at a table that size and just scan it anyway. If the queries against a table are not highly selective, such as in the case where the selection is on Male or Female and the values are evenly distributed, an index is not useful there either. Check to ensure that there is not an index already covering the columns you are about to index. Having double indexes on a column is a waste of space and maintenance time. Creating indexes is an intricate task, and unless you are familiar with the data access patterns, it is easy to do incorrectly. In a few moments, I show you a useful tool that will help you and your developers select and create good indexes. Full-Text IndexesFull-text indexes enable you to quickly locate text within char, varchar, and nvarchar data types, by using a special engine. It is useful for searching for phrases and other patterns of words. You can even use it to search binary data such as Microsoft Word or Excel documents that you have stored in the database using a varbinary(max) or image data type. You can use several language tools to search the data, such as FREETEXT, FREETEXTTABLE, CONTAINS, and CONTAINSTABLE. You can use full-text indexes for queries against linked servers, against various sets of columns, and XML data. You can also specify the language to be used for word breaking in an index, which is how SQL Server 2005 knows that a word is broken out within the data. A full-text index is not controlled the same way other indexes are. Full-text indexes are controlled by the Microsoft Full-Text Engine for SQL Server Service. Full-text indexes are stored in a full-text catalog, one per database. You need to store the full-text catalog on a drive directly connected to SQL Server 2005. Some restrictions apply as to where you can create a full-text index. To create one, you need a single, unique, not-null column in that table. This column is what SQL Server 2005 uses to locate the text you are looking for. Because the indexes are managed separately, you need to run a process to "populate" them, or fill them with data. A full population completely rebuilds the index, and depending on how large the data is this can take a long time. When a full population is complete, you can use a change tracking-based population, which is an update operation on the index and completes much faster. If your table has a timestamp column, you also have the option of an incremental timestamp-based population, which updates the index based on the timestamp column. To create a full-text index, you can use a graphical method or with T-SQL commands. Creating a full-text index using SQL Management Studio is the simplest method because the entire process is wizard driven. When your table meets the requirements for a full-text index, right-click it and select Full-Text Index and then Define Full-Text Index from the menu that appears. Select the unique column and the columns you want to index, and the wizard will lead you through creating a full-text catalog. As the final step, you will be able to set up a population schedule that will run automatically. When the wizard completes, you will have a full-text index, fully populated with data. To create the full-text index in code, you first need a full-text catalog, which you create with the CREATE FULLTEXT CATALOG command. You can use several options, but you do not need to specify any to create one. I normally set the path for the catalog and declare the catalog to be the default, if applicable. Here is a script that creates a full-text catalog called DefaultFullTextCatalog on the C: drive in the Catalogs directory. It also sets this catalog as the default for the database: USE DBAMDT; GO CREATE FULLTEXT CATALOG DefaultFullTextCatalog IN PATH 'c:\Catalogs\' AS DEFAULT; GO The new full-text catalog is now available for new full-text indexes. This next script creates a full-text index on a table called dbo.Documents for the Description column. The unique key for this table is called DocID. The end of the script contains a statement to automatically keep up with the data changes when new text is placed in the column: CREATE FULLTEXT INDEX ON dbo.Documents(Description) KEY INDEX DocID; WITH CHANGE_TRACKING AUTO GO The WITH CHANGE_TRACKING option has three possible choices: MANUAL, AUTO, and OFF. The MANUAL setting means that you will have to use the SQL Server Agent to set up jobs to schedule the population, AUTO does it for you when data is entered, and OFF means that the server will not track changes in the index.
If your developers are using WRITETEXT and UPDATETEXT statements, the changes are not detected with change tracking. To populate the full-text index in code, use the ALTER FULLTEXT INDEX statement. The following script updates the full-text index the previous scripts created: ALTER FULLTEXT INDEX ON dbo.Documents START UPDATE POPULATION GO The UPDATE population repopulates only the changes because the last full population. In addition to the UPDATE type of population, you can also use FULL, which completely rebuilds the full-text index, or INCREMENTAL, which requires a timestamp column. You should time the full-text index operations using either the Windows System Monitor with the full-text index counters in the SQL Server objects or by using SQL Profiler. When you know how long these operations take, you can create or alter your population schedules. Data StructureAlthough not as obvious as the other optimizations, you can greatly affect the speed the server responds to queries by setting up data structures properly. Although this book does not specifically address database design, the basic premise is that the database should reflect the data access. It matters how much data there is. The more data there is, the more page-split operations there are, where SQL Server has to move to the next storage unit (page) to return all the data requested. You can do little about the amount of data in the database, but you can make sure that you keep the database maintenance up-to-date so that it is as contiguous as possible. It also matters where you place the data. If two tables are accessed at the same time quite often, it is best to separate them onto their own physical devices. Separating data files, log files, indexes, and the tempdb database onto their own devices helps a great deal, if you are outside a storage area network (SAN) environment. Another place to look is how normalized the database is. Normalization describes how segmented the data is into separate tables. To oversimplify a bit, if a database is fully normalized, each individual data set is in its own table. As long as you are selecting or inserting data in only a few tables at a time, the operations are fast. The more joins you have to make to insert or select the data, the greater the odds that the operation will slow down. That is not to say that normalized databases are slow; it is just that normalization does have performance implications. There are times, such as in reporting systems, that it makes sense to denormalize the data to make its retrieval faster. Most of the actions you need to take are difficult to untangle and find. Data dependencies and program interactions make it hard to even know where to start. Even developers might find it hard to make changes to the structure after the database is in use. SQL Server 2005 has a tool that will help with data changes, called the Database Tuning Advisor (DTA). The operation is similar to SQL Profiler; you run the tool while users or testers access the database. After a representative period of activity, you stop the tool and examine the recommendations. Just like SQL Profiler, it is vital that you operate the applications as much as you can during the DTA evaluation period. The more activity you have, the longer you have it, and the more parts of the application the users exercise, the better the results. The DTA also has multiple reporting options to show you how the database performed, what changes are suggested, and more. You are also able to save the recommendations as a T-SQL script, so that you can review the changes, alter them, or execute the ones you want. This is the method I use most often. You can get to the DTA from several places, including from the Windows Start menu in the SQL Server 2005 item, from the SQL Profiler after a trace run, and in the Management Studio. The process is similar to using the SQL Profiler: Open the tool and select the options, monitor database activity, and stop the tool. The difference is that SQL Profiler shows you the results of the activity, with as much or as little detail as possible. The DTA does not display all the activity unless you ask it to, and it recommends and can implement changes to your database. You also get an estimate of improved performance. Before you use this tool, there are a few caveats with its use. As I stated earlier, the more representative the activity, the better the recommendations are. In fact, if you monitor only one or two statements out of a whole, you might do more harm than good. Second, you should perform a full change review with as many people as you can. It is common to see changes take place on a large system only to have some hidden workaround break the entire process. Finally, take a backup before you start. As I stated in the earlier chapters, I do not recommend going into any situation without an exit strategy. Ask yourself, "What am I going to do if this does not work?" If the answer is "I am not sure," don't do it. With that in mind, let's walk through an example of using the tool to watch some activity on a test server to see its capabilities. To begin, you need either a trace file from SQL Profiler or a T-SQL script in text. If you are going to tune a large system, you will want the trace file; and if your developers want to see how a group of statements might act in a test, you should use the script file. Microsoft calls both of these a workload. On my test system, I will use the SQL Profiler trace I created with that tool earlier. When you open the tool, you are asked to connect to a server. I recommend that you do all tuning on a test system, because an improvement on one will normally represent an improvement on another, unless the architecture (such as 64 bit versus 32 bit) is completely different. When you connect, you are presented with the General panel, as shown in Figure 5-15. Figure 5-15.[View full size image] 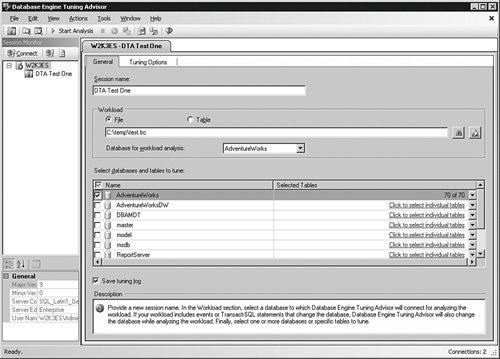
Here you are asked to name the file and select the location of the workload file, or if you sent the trace to a table, you can specify the table and database name where that is stored. You are also able to set the database and tables that you want to tune. The reason you might want to tune a particular table or set of tables, and you do not want the tool to recommend that you remove or create indexes and other objects that the workload does not affect. The next tab, shown in Figure 5-16, shows the Tuning Options panel. Figure 5-16.[View full size image] 
You can limit the time the engine will run to tune the system; but the longer you allow it to run, the better. In this case, I have not limited the engine at all. You can also select the options that the engine will use to decide what recommendations to make. The first set of these options asks what kind of indexes the optimizer should consider in tuning. The second set of options deals with the physical portioning. In some cases, you will have the ability to change the partitions; in others, you will not. If you know that you are not able to change the partitions on the system, select No partitioning. In the last set of options, you can tell the system how much free reign it has with the physical layout. Allowing the system to suggest any changes with the Do not keep any existing PDS is a powerful, and in some cases dangerous, option to choose. Setting this option in effect allows the engine to second-guess the database designers. I usually set this option to see what choices the system makes, but I rarely implement them. There are just too many variables that may not have been captured in the workload to allow the system to have carte blanche on the physical design. After you have set all the options the way you want, click the Start Analysis button in the icon bar. As the workload processes, you are placed in a panel showing the progress of the activity. When it completes, you are shown the list of recommendations for the various options you selected. As shown in Figure 5-17, you can select or de-select any of the options that you want to show up in the final change scripts. When you have made your selections, click Actions and then Save Recommendations… in the menu bar. The tool creates a script file with all of the statements needed to implement the changes, in the proper order. You should never select the Apply Recommendations… item, even if you are sure that is what you want to do. Creating a script file allows for a controlled change and documentation for your exit strategy. Figure 5-17.[View full size image] 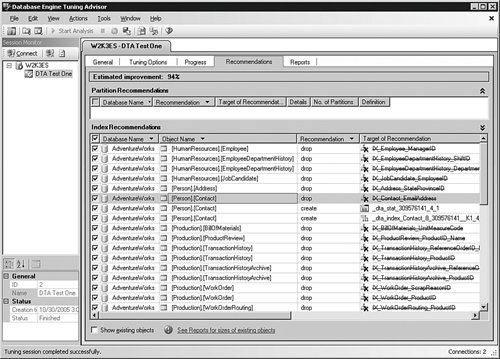
On the Reports tab shown in Figure 5-18, you can view several tuning reports. If you right-click inside any of them, you can copy the data to the clipboard or send them to a file. Saving these reports electronically allows you to collaborate with your developers on any proposed changes. Figure 5-18.[View full size image] 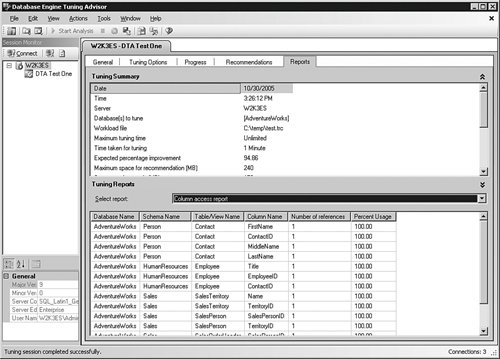
In the Management Studio query window, you can select Analyze Query in Database Engine Tuning Advisor from the Query item in the menu bar. The process to use this method is the same as you have just seen, with the exception that you do not have to provide a workload file. The query from the Management Studio is already loaded, ready to execute. ApplicationsIf you optimize a platform to a perfectly balanced state, you may be able to gain up to 15 percent speed increase on the same hardware. Applying indexes properly can gain you much more. The biggest factor in performance, however, is within the applications written against the server. The DBA does not often have control over the queries used by the application, but you can help your developers gain an awareness of how they can use SQL Server 2005 in the most effective way. Most applications benefit from a "selection review." What this means is that each query in the application should affect no more data than is absolutely necessary. In the case of data selection, the query should return only the data needed to satisfy the request. In the case of an insert or deletion, the query should only touch the tables it has to in order to make the change. That sounds like common sense, but in a surprising number of cases the developer takes a shortcut by returning a huge amount of data to the client to be processed there. In a single instance, this is not even noticeable; multiplied by thousands of requests, however, this practice can adversely affect the performance of the system dramatically. Another application change your developers can make is by using transactions properly. By pooling connections and other aggregation methods, the programs are able to make fewer trips to the database. It is all about taking as light a touch on the engine for as little time as possible from the applications. Although not directly a programming issue, it is important to track the applications that use the database. Often, the application has been properly tuned, the servers, workstations, and network are configured correctly, but the application still performs poorly. On these occasions you should check to make sure only the authorized applications are using the database. It is tempting to hook other applications, especially for reporting, into the same database that has been tuned for a particular application. If you have secured the database, this should not happen, but performing a security audit should turn up the guilty applications. Remove those and you have got a fast, easy, and inexpensive performance upgrade. Refactoring QueriesRefactoring a query means to try all the possible statements and methods of accessing the same data. Developers evaluate all these to ensure first of all that the data is consistent with what they want and that the query runs faster. After using the various queries, the developer eventually settles on a query that has the best performance. Using SQL Server Management Studio, you can see the statistics for a query as I explained earlier in the chapter. I also explained how to show an execution plan, and this function is far more useful to refactor the queries. There are two modes to show the plan, graphically and in text. In this example, I have opened Management Studio and created a new query window. I typed in a rather lengthy query and then selected Query and then Include Actual Execution Plan from the menu bar. After that, I ran the query, just as I explained in the earlier example. After the query ran, I opened the Execution Plan tab. In Figure 5-19, I right-clicked within that panel and then selected Properties from the menu that appeared. Figure 5-19.[View full size image] 
When you run a query this way, you can hover over any icon in the graphical panel to show lots of information about that step, but in some cases the output obscures the entire window. It is often more convenient to open the properties, as I have here, and then click each icon to show what is happening on the server. To analyze the output, you (or the developers) start on the far-right side of the graphical panel. You are looking for the highest-"cost" item within the panel. You are also looking for the proper use of indexes. Unless there are fewer than a thousand rows or so, the query should use an index. There are many elements within the plan, and none of them are bad or good by themselves. In general, bookmark lookups are good, table scans are bad, and an index seek operation is better than an index scan operation. But that is just in general and depends a great deal on the query. You can save an execution plan out to a file, and read it into another query window, even on a different system. Right-click inside the Execution Plan graphical window and select Save Execution Plan as from the menu that appears. You can save it as a SQL Server execution plan with an extension of .sqlplan, or you can just save it with an XML extension, because that is the format for the file. You can read it in to an XML editor or into another copy of Management Studio with the File and then Open menu items. You can use this feature to mail the plan around for discussion and review. You can also show the same information in text. At the top of a query, insert the following lines: SET SHOWPLAN_ALL ON GO Now run the query again. You will get a text output similar to Figure 5-20 that some find a little easier to read than the graphical icons. Figure 5-20.[View full size image] 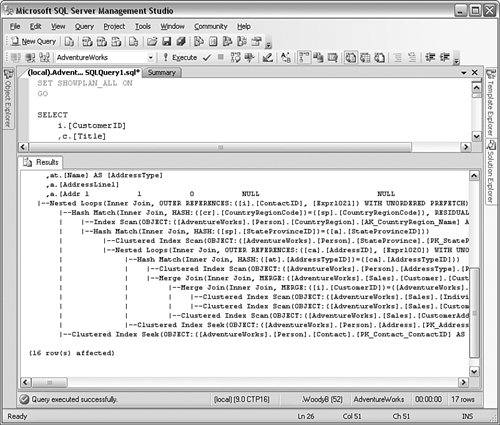
Although you might not use the execution plans yourself, you need to be aware of security implications. Make sure that you grant this right only to developers who need it. To grant a developer the right to view the query plan, use the following command:
GRANT SHOWPLAN TO username
GO
Leveraging the PlatformAs a final application optimization step, developers should always leverage the SQL Server 2005 platform. This means studying the features, structure, and limitations of the platform, so that the programs use the latest, most-efficient methods to access the data. Companion books to this one will help the developers take advantage of the latest coding techniques and the newer features and syntax that SQL Server 2005 offers. Although it needs to be handled with tact, always question whether the code is using everything it can to perform at its best. |


