Reporting Services Architecture
|
Let's begin at the "front" of the system by briefly exploring a report. A report is a text file that contains a definition and at least one data source. The definition contains a description of the report, such as formatting, layouts, sections of data, and other report elements. The data source contains all the connection information for data along with a query that pulls it back to fill out the report. When the report is created, it is stored in a Reporting Services database on a Reporting Services server. This database, called the catalog, is named starting with the words ReportServer, with the name of the instance attached, if applicable. Multiple Reporting Services servers can point to this same database, which provides one point of scale-out for the system. Reporting Services uses another database, called the ReportServicestempDB (again with the name of the instance attached, if applicable) to hold the results of reports or perform sorting and other temporary operations to process the reports when called. That is an important distinction, and something we should take a little time to understand. Although my developer friends and Microsoft might cringe to hear me say it, Reporting Services has a lot in common with a mail-merge operation in an application such as Microsoft Word. In a mail-merge process, you create a "master" document, which has some static data, formatting, and perhaps a picture or two, and combine it with "fields," which are just placeholders where other data will go. You then attach to some sort of data, such as a spreadsheet, database, or even a text file, and then combine the data with the master document. The master document is used only once, and the fields in it are replaced with the individual bits of data from the data location into a new document or set of documents. The master document never changes; if more data is added in the data location, however, any new mail-merged copies will have the same document with different data. That is similar to how Reporting Services works. The "master document" in this case is called a report definition, and the "data location" is called a data source, which is the connection you make to whatever information the designer wants to include in the report. The source data is not stored in the Reporting Services database, but the report definition is. When the report is called, the data source is combined with the report definition to produce a report.
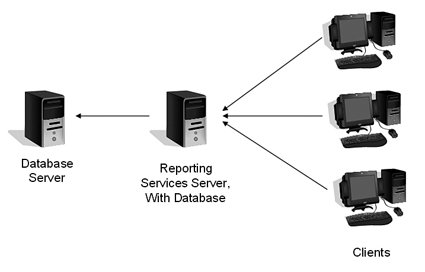
Users will call the final product a "report." That is why Reporting Services makes the distinction for the master document, calling it a report definition. It is easy to get these terms mixed up, especially during design discussions. The difference between a mail-merge operation and report-processing operation is that Reporting Services can talk to far more data sources than Microsoft Word, even using different data sources within the same report, and has a powerful storage engine. It can also schedule reports to run at a specific time, or even distribute the reports to users based on a schedule. Another difference is that you can provide not only a static report to the users but a report model, which is a kind of framework for a report. The users can use that framework to create their own reports using a Web-delivered tool. It is a great way to deliver a type of "ad-hoc" reporting while maintaining control over how much data the user can pull down from the system. The engine for Reporting Services is composed of a Windows service and a Web service. The Windows service, called SQL Server Reporting Services, runs and manages the reports for the instance where it is installed. The Web service provides a connection to the Reporting Services server from the clients that need the report and is stored and processed in IIS. The Reporting Services processing layer handles more than just connecting to the data and filtering it through report definitions. The server(s) also "render" the report, which is the process of encoding the output into multiple possible formats such as HTML, Excel, PDF documents, and more. Reporting Services handles security for the process and also monitors and tracks report processing progress. Users can access reports directly from the Reporting Services Web interface, or they can use a report created by a developer right inside their application. Yet another way that users can receive reports is on a scheduled basis, in their inboxes on e-mail or on a personal digital assistant (PDA) device. Regardless of how they receive the report, they get it from one or more Reporting Services servers. Deployment ModelsYour deployment will fall somewhere between two extremes. On the one side, you have a simple setup designed to move the reporting processing load from your production application servers. At the other extreme is a setup involving multiple servers accessing data from multiple databases. In any model, you have to make a decision about the source data. If you are accessing text files or Excel spreadsheets, you do not have to deal with much contention for the data sources. If you are accessing the OLTP system, you will impact the performance while the system reads the data for the reports. A better design is to place a copy of the production data on another database server using database mirroring or replication. That provides reasonably current data without impacting the production system. Check Chapter 6, "High Availability," to find multiple strategies to copy data from one server to another. For a small application, you can set up Reporting Services on a system separate from your reporting database server and either code the application to use the Web service it provides or point the users to the server's name in a Web browser. This deployment model splits the data from the processing, formatting, and delivery of reports, as shown in Figure 9-5. Figure 9-5.
If your needs are slightly more complex, you can add more Reporting Services servers, each with its own report and tracking databases. In this deployment model, you have to direct the users to the server that runs their particular report. This layout is shown in Figure 9-6. Figure 9-6.
At the higher end of the spectrum, you can balance the load among multiple Reporting Services servers. You have two methods of doing this. The first is that you can install Reporting Services on multiple servers, taking the "files only" option and not choosing the standard configuration as we did earlier. In that case, you return to the configuration tool I described in the preceding section and set up various servers to talk to a single Reporting Services report database. That system then accesses the source data for the other servers, and they present the report. This layout is shown in Figure 9-7. Figure 9-7.[View full size image] 
To balance the Web servers, Microsoft provides a set of checklists for configuring the servers to connect to the database and to talk with each other. You can find that checklist on the Web on Microsoft's Reporting Services site or in Books Online under the topic of "Configuring a Report Server Scale-Out Deployment." This type of setup involves steps that change over time as the .NET Framework is updated, so I do not reproduce that information here. It is best that you check a current source for that process. Whichever layout you choose, plan it thoroughly before you begin. The best process to follow is to design the system with the ability to grow and then monitor it proactively. If you keep your design flexible at the outset, you can add components to your layout as needed. This is important not just for the servers but the design of the reports. Everyone, from the report developers to the administrators, should keep things such as data sources as object oriented as possible. Keeping the components independent and well documented allows you to grow the system with minimum impact. |