Report Design and Creation
A bewildering array of information is available on how to design effective reports. The skills you need to design reports include knowledge of graphic design, programming, the source data systems, and even the organization's structure, to name just a few. I do not cover the complete design process here because our focus is more on administration. You should, however, be familiar with the various types of reports developers create and what reporting tools are available. I guide you through those and then we create a simple report using a wizard and another using the other tools. Report TypesReports are stored as a text description using RDL (more on that in a moment), but they are broken down into conceptual types based on how they are created, processed, and accessed. Web BasedThe default mode for accessing a report is to use the Reporting Services Web site. Earlier I had you test your Reporting Services by accessing the site. You can access the Web site using the address I showed you earlier: http://SERVERNAME/Reportsor http://SERVERNAME/Reports$INSTANCENAME This Web site is arranged like a file system using folders, which contain reports or other folders. I cover that a little more in a bit. ApplicationIt is not always convenient for the users to leave their application and open a Web browser to look at reports. A more common method for accessing reports is through an application. Developers write code to access the reports using .NET methods by invoking a proxy Web service. When they connect to the proxy service, the application instantiates a method against that service, which interacts with the reports.
Developers can also use the RS.EXE command-line program to control reports. This is used less often but is useful for scripting applications. Another way that developers can embed a call to Reporting Services in their applications is to use the Simple Object Access Protocol (SOAP). Developers can invoke this kind of call in the application by using a SOAP application programming interface (API) in their language of choice. This is the most portable method and allows you to use even non-Microsoft-based platforms to call the reports. Ad HocA hot-button topic in report design is whether or not to allow "ad-hoc" reporting. Ad hoc means that end users define what they want to see and how they want to see it. The users get a development environment, which enables them to connect to data sources and create their own reports. A true ad-hoc environment is rarely implemented because a careless query can completely immobilize a system. Users have to be carefully educated even in environments where this feature is used in a limited fashion. Users, on the other hand, desperately want ad-hoc capabilities in their report environment. Many times, they are not able to fully articulate their reporting needs during the application design process, or they want the ability to explore the data freely. These are real needs, despite the desire on the part of the developers to more tightly control the process. Reporting Services provides a feature to help. Developers can create a report model, which is a predefined report structure stored on the Reporting Services instance. The report model contains friendly "business" names for the fields referenced in the data source, the relationships the data sources have with each other, and groups of items that the users can select from. The users connect to the Reporting Services Web site, and a special ActiveX control is downloaded to their machine. The control gives them a design environment where they can add text and formatting, pull down and lay out the individual fields from the data sources, and even navigate through the data the report can access. Developers can also enable the report model to be able to drill down through the data in the report, if it is viewed on the Web or in an application. Even though the developers can create report models that the users can access, they need to test each scenario to determine the impact to the system. Leaving too much access or allowing connections to production data still runs the risk of creating performance issues. Report models provides a layer of protection, but if you are not careful, you can still create a design that adversely affects your system. Report Definition LanguageReport definitions are stored in a specialized application of XML called Report Definition Language (RDL). The beauty of storing the reports this way is that it allows an open platform for Reporting Services. It also provides developers a way to build a report on one system and transfer it to Reporting Services seamlessly. RDL is not the transport protocol for the report definition; it is the payload. Developers can load the RDL through several methods. Your developers can find a complete set of examples for creating and uploading RDL programmatically in the Samples directory if you installed them when you installed SQL Server 2005. You can also load RDL files in the Reporting Services Web interface. I do not reproduce the XML element set for RDL here because it is lengthy and deals with the layout of the report. You can find a complete list of the RDL elements that Reporting Services supports in Books Online under the topic of "Report Definition XML Elements." You can find other definitions of these elements on the Web, too. Microsoft also includes a complete entity-relationship diagram under the topic "Report Definition XML Diagram" in Books Online and on their Web site. Design and Development ToolsThere are a few ways to interact with Reporting Services, from command-line tools to full integrated development environments (IDEs). In this section, I deal with the graphical tools used to create reports, and in the "Management" section I explain the graphical tools you can use to manage the process. This is not an exhaustive coverage of these tools because we are not focusing on designing reports. Instead, it gives you a quick tour of the interfaces your users and developers have available. Report DesignerThe Report Designer is a template item called Report Server Project within the SQL Server Business Intelligence Development Studio. You can find that in the SQL Server 2005 item in the Windows Start menu. You can see the result on my test system in Figure 9-8. Figure 9-8.[View full size image] 
I do not cover the screen layout for this tool because we already explored it briefly in the preceding chapter and we cover it in even further depth in the next. The audience for this tool is the report developers in your company. They will use this Visual Studioderived interface to create "canned" or static reports, or the report models that the users have to work with in the Report Builder tool. Model DesignerAlso found in the SQL Server Business Intelligence Development Studio is the Report Model Designer. Once again, the audience is the report developer, who performs the same steps as creating a static report, with the exception of layout and formatting. When the report model is deployed to the Reporting Services server, select users can connect to the model and create their own reports, based on the data sources and restrictions the model contains. This is the primary tool you will find for the Business Intelligence landscapes based on Microsoft SQL Server 2005. In the "Take Away" section of this chapter, I demonstrate how a report model is created with this tool. Report BuilderThe Report Builder is a full development environment for the users. That is not to say that all users need to create reports; most just want to view reports created for them. For those who need an ad-hoc view of data, the developers can create report models in the Business Intelligence Development Studio, which are then deployed to a server. Users connect to the Reporting Services Web interface and click the Model folder. Once inside, they can click the Report Builder button on the Web page that contains the models, shown in Figure 9-9. Figure 9-9.[View full size image] 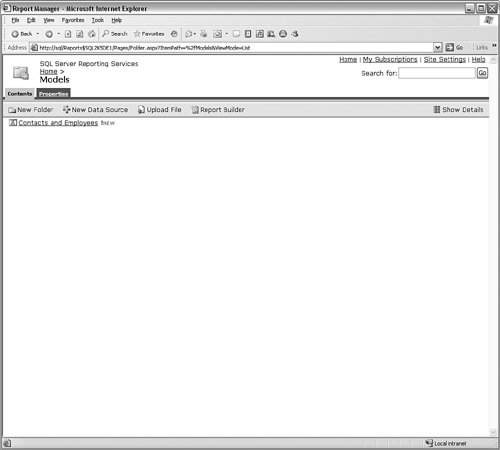
This button starts a download of the Report Builder program, as an ActiveX component. When the download is finished, users have a complete development studio to create their own layouts, formats, and destinations for the report based on the limitations created in the report model, as shown in Figure 9-10. Figure 9-10.[View full size image] 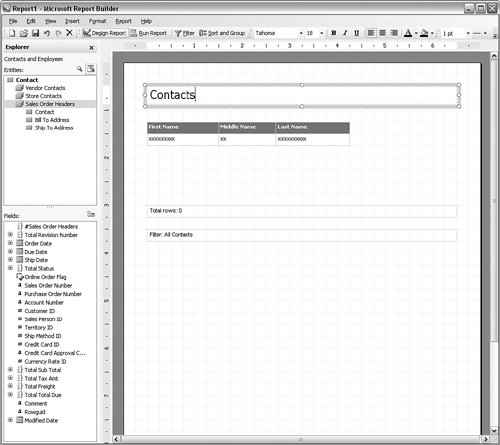
When users create the report, they can save it to any of the folders they have been given rights to, from their own to those created by the developers. I show you how to grant those rights in the section on security. Creating ReportsI want to stress here that we are not going to spend a great deal of time in the layout and creation of reports. There are so many concepts in that area that we would lose track of where we were. This chapter is more concerned with the management and deployment of those reports, but we do need a few to work with. In this section, I show you how to create a test report using a menu-driven wizard, and then I show you a more useful production report that will help you watch your databases for growth. Although I do not cover creating report models in this section, you can follow the same process as the other two reports to create one. Select Report Model from the Create New Project menu item after you have completed these exercises to create and deploy a model on your test server. Using the Report WizardThe easiest way to create a report is to use the Report Wizard in the SQL Server Business Intelligence Development Studio. Let's create a report from the AdventureWorks database showing a product listing using the Report Wizard. To begin, open the BI Development Studio and select the Project… item from the Create link in the left side of the screen. From the Visual Studio Installed Templates area in the right panel of the dialog that appears, click the Report Server Project Wizard item and then give the project a name in the lower box, shown in Figure 9-11. Figure 9-11.[View full size image] 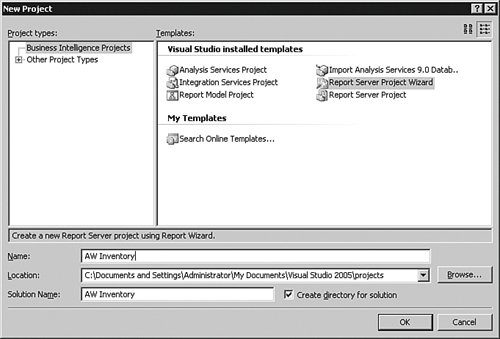
When you click the OK button, the first panel of the wizard explains what you are about to do. Click the Next button to move on. The first item the wizard creates is the data source. In this case, you can select the New Data Source radio button and name it Adventure-Works. I like to set the data sources to the generic name of the source I am connecting to. You might be tempted to set the source to AWInventory or some other specific name, but in fact the connection is to the database itself. After you have entered a name, leave the Type box set to Microsoft SQL Server and click the Edit button. This brings up a panel where you can select the name of the server, the database, and the credentials that you want to assign this data source. Make those selections for your test system and click the Test Connection button. When that is successful, click the OK button to return to the data source creation panel of the wizard. You will see the connection string filled out for you. Instead of clicking the Edit button next time, you can just type in a string like this if you are familiar with the format. Selecting the Make this a shared data source check box makes this connection available outside of this report; otherwise, the complete connection information is part of the RDL. Click Next on this panel after you have made your changes. The next panel that appears is the query designer. We have made our connection to the database, and now we need to select the specific data we want to include in the report. You have two options for entering data on this panel. The first is to type a Transact-SQL (T-SQL) statement in the bottom text box. If you already know what you are looking for, this is the fastest way. If you are not sure of the table names or the exact query you want, click the Query Builder button. Once inside this panel, you are not much better offat least at first. You are placed by default in a text editor for T-SQL. Click the "pencil" icon in the upper left, and you are placed in a more graphical selection area, much like the query designer in Microsoft Access or Excel. Click the small icon with a plus sign in it to bring in tables from your data source and make your selections for the columns they contain. In this case, you are looking for the Product (Production) table and the Name, ProductNumber, and ListPrice columns. When you have finished, click the OK button, as shown in Figure 9-12. Figure 9-12.[View full size image] 
When you return to the Design the Query panel in the wizard, the T-SQL that is derived from the graphical interface is entered for you. If you want any sort options, it is often better to put them in the report so that you take the lightest touch on the source system, but in this case I have added an ORDER BY statement to my query, so that it ends up with this text: SELECT Name, ProductNumber, ListPrice FROM Production.Product ORDER BY Name Click the Next button to move on to the next panel. In the Select the Report Type panel of the wizard, you are asked to set the layout for the report. If you are following along, just leave the defaults here and click Next to continue. The Design the Table screen allows you to set page breaks and grouping, which we do not take time to explore here. Click Next to continue. The Choose the Table Style panel gives you some template options for the report. Choose any option you like and then click Next to continue. The Choose the Deployment Location panel sets the server that will process the report and a folder that the users will see if they use the Web browser method of looking for the report.
Make sure you check the name of the server in the location, because the wizard may not detect the name properly. In my case, because the report server is on a named Instance of SQL Server called SQL2K5DE1 on the server named SQL, the string becomes http://sql/ReportServer$SQL2K5DE1. Entering the wrong name does not cause the preview to fail, but the report will not build properly if the server name is incorrect. Click Next when you are sure of the server's name. Finally, you are asked to name the report. Type in AW Inventory and select the Preview Report box. Click the Finish button when you have made those changes. If everything is set up properly, you are dropped back into the Business Intelligence Development Studio with a preview of the report. You can see the results in Figure 9-13. Figure 9-13.[View full size image] 
If you want to make any changes to your report, you can click the Layout tab and set any fonts, spacing, color, and other options. When you are all done with those changes, make sure you select the Build and then Deploy items from the menu bar. When the build and deploy operations complete successfully, enter the Report Server name in the browser in this format: http://SERVERNAME/Reportsor http://SERVERNAME/Reports$INSTANCENAME You should see a link to the folder you created there, and you should see a link to the report within that, as shown in Figure 9-14. Figure 9-14.[View full size image] 
Creating a Report ManuallyLet's build another report, this time without using the wizard. This report will be one that you can use in production. We create a query for the data source that shows the tables in a database, along with the space they take and the space taken by their indexes. Using this report, you can audit how fast your tables are growing. This is a common thing to do on newly developed databases. It is not difficult to create a simple report manually, following the same progression that we did in the previous section. Here is the checklist we follow in this section:
Let's begin. If you are still in the Business Intelligence Development Studio, click the File and then Close Project item from the menu bar. Save the project if you are prompted. Click the Project… from the Create link in the left pane of the main screen. Select the Report Server Project item and name the project Table Sizes as I have in Figure 9-15. Figure 9-15.[View full size image] 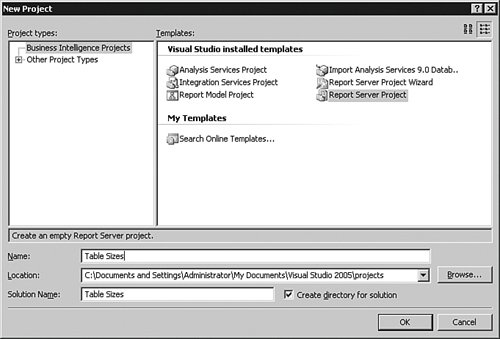
This time you are dropped right into the project. Right-click the name of the project (Table Sizes) in the Solution Explorer, which you will normally find on the right slide-out panel. Select Properties from the menu that appears and enter the name of the Reporting Services instance in the TargetServerURL box, shown in Figure 9-16. Figure 9-16.[View full size image] 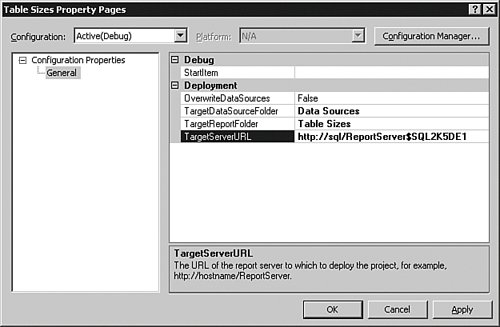
Remember, this is the name of the Reporting Services instance that processes the reports, not the site where the users view the report. This name should have ReportServer somewhere within it. Right-click the Shared Data Source item just below the project name (Table Sizes) and select Add New Data Source from the menu that appears. Follow the same procedure that we did in the previous section to add a database name. In this case, pick any database that you are interested in creating an audit for. In my case, I have chosen to connect once again to the AdventureWorks database, naming the data source AdminAdventureWorks for clarity. Next, right-click the Reports folder in the Solution Explorer and select Add and then New Item from the menu that appears. If you select Add New Report, you will start the wizard process again. When you click the New Item menu object, you are presented with a list of choices. Select Report from the list and name the report Table Sizes.rdl. Click the Add button when you have finished. You can see the results in Figure 9-17. Figure 9-17.[View full size image] 
Now you are placed within the report designer for the Business Intelligence Development Studio. We need to create a dataset to work with, which is the result from a query. Click the New Dataset… drop-down menu item in the center top of the screen in the Dataset box. You are placed in the Dataset properties box where you have lots of control over what you want to pull back and how you want to get it. For this report, enter the name TableSizeQuery in the Name box and then enter the following text in the Query string text box: SELECT INFORMATION_SCHEMA.TABLES.TABLE_NAME "Table Name", sysindexes.rows "Rows", ((SELECT sum(dpages) FROM sysindexes WHERE indid < 2 and id = sysobjects.id) + (SELECT isnull(sum(used), 0) FROM sysindexes WHERE indid = 255 and id = sysobjects.id)) * (select v.low / 1024 from master..spt_values v where v.number=1 and v.type=N'E') "Data Space (K)", (SELECT sum(used) FROM sysindexes WHERE indid in (0, 1, 255) and id = sysobjects.id) * (select v.low / 1024 from master..spt_values v where v.number=1 and v.type=N'E') - ((SELECT sum(dpages) FROM sysindexes WHERE indid < 2 and id = sysobjects.id) + (SELECT isnull(sum(used), 0) FROM sysindexes WHERE indid = 255 and id = sysobjects.id)) * (select v.low / 1024 from master..spt_values v where v.number=1 and v.type=N'E') "Index Space (K)" FROM INFORMATION_SCHEMA.TABLES INNER JOIN sysobjects ON INFORMATION_SCHEMA.TABLES.TABLE_NAME = sysobjects.name INNER JOIN sysindexes ON sysobjects.id = sysindexes.id WHERE INFORMATION_SCHEMA.TABLES.TABLE_TYPE = 'BASE TABLE' AND sysindexes.indid < 2 ORDER BY "Data Space (K)" DESC , "Index Space (K)" DESC That is a lot of typing, but it is worth it. Figure 9-18 shows what my test system looked like for those entries. Figure 9-18.[View full size image] 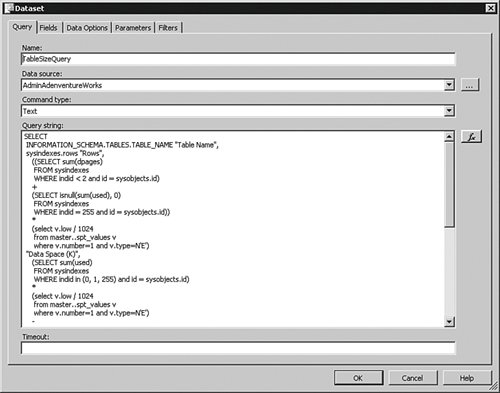
When you click OK on this panel, you are placed in the Data tab of the Business Intelligence Development Studio. You can click the exclamation icon to run the query and see the results. Now click the Layout tab in the Business Intelligence Development Studio. You may have to auto-hide many of the panels to get any usable space to work with the report. Open the Toolbox panel (usually found on the left side of the screen) and drag the Table object onto the report, as you can see in Figure 9-19. Figure 9-19.[View full size image] 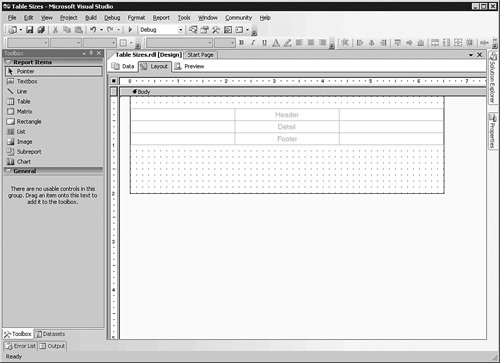
We need four columns in our table, and we only have three. Click the top gray bar of any of the columns to select it and then right-click in that selected area. Add a column to the left or right. You have three main areas to work with in a table: the header, the detail, and the footer. Whatever you put in the header and footer will repeat at the top and bottom of the report. The detail lines show up once for each row of data. In the upper-left cell of the header, double-click and enter the text Table. In the second cell of the header, double-click and enter Rows and then Data Space and Index Space for the third and fourth cells in the header. In the first cell of the detail, right-click and select Properties from the menu that appears. Click the drop-down menu for the Value item and then select the formula =Fields!Table_Name.Value. This item comes from our query; it is the first part of the SELECT statement.
You can also select the Datasets tab at the bottom of the toolbox and drag the fields from there, or you can enter the formulas by typing them in the detail cells. Repeat this process for the remaining three columns, selecting =Fields!Rows.Value, =Fields!Data_Space__K_.Value, and =Fields!Index_Space__K_.Value for the Value items in those cells. Your report design screen should look similar to Figure 9-20. Figure 9-20.[View full size image] 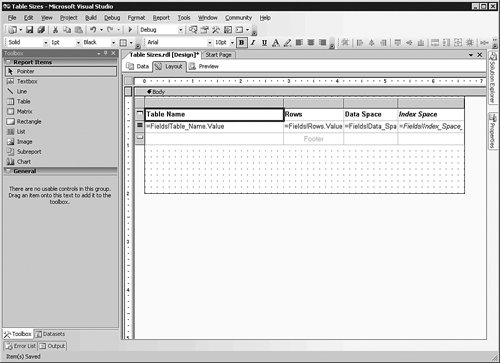
You can format your cells in any way you see fit, and add graphics, text, and other objects to the report if you like. I am going to bold the header cells and leave it at that for this exercise. Save your work by clicking the multiple disks icon and then click the Preview tab to see the results. When you are satisfied with the report, click the Build and then Deploy items from the menu bar. If you have set your server's name properly, you should be able to view the report on the Web site that we accessed earlier for the Inventory report, as on this test system screen in Figure 9-21. Figure 9-21.[View full size image] 
|


