Tools
|
You will use multiple tools to manage the server and interface with the databases. For the most part, you will use the SQL Server Management Studio to work with a graphical interface and sqlcmd for the command-line interface. Other tools are installation specific, such as the Business Intelligence Studio and the Reporting Server tools. I cover those separately when I explain those products in detail. I explain a high-level view of the tools in this chapter so that you can get an overview of how they work. I use these tools extensively in the rest of the book, so I introduce advanced concepts along the way that deal with the process at hand. This section is just an introduction. SQL Server Books OnlineBooks Online is the primary help source and documentation for SQL Server 2005. You can find it on the Start menu under Microsoft SQL Server 2005 > Documentation and Tutorials >SQL Server Books Online. When you first run Books Online, you are asked whether you want to favor Internet content or local content. I normally favor local content because I travel a great deal, and do not want to pay the time penalty for online detection. If your system is always connected to the Internet, you might want to consider favoring online methods because you will get the latest information.
Check the Microsoft SQL Server site for updates to Books Online. The updates are delivered as a simple installer file and will not harm or disturb any of the database files you have installed on your system. Books Online is an HTML-based help system that includes three tabs. The first tab is the Index tab, where each topic is listed alphabetically. As you type, the tool locates the topics by that name. If the topic is too broad, you will see indented subtopics below it, as you can see in Figure 2-2. Figure 2-2.[View full size image] 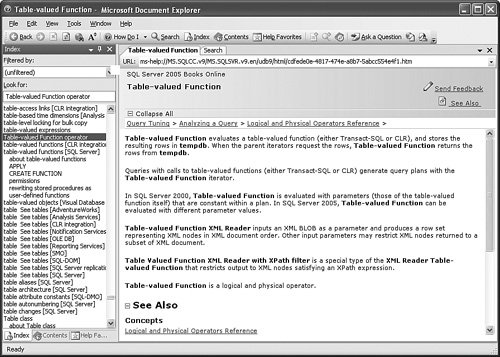
The second tab is the Contents tab, shown in Figure 2-3. This section reads more like a book and draws you through the documentation in a topical, sequential manner. You will also find some tutorials here, and I highly advise that you explore each one. Some are quite short, others are more involved, but all have valuable information that will give you an overview of topics all the way from the tools through data mining. Because Books Online is a Web-base product, there are already forward and back controls for the page you are looking at. In the case of a tutorial, you need to add another set of controls to navigate through them. To do that, click the menu bar item called Tools and then Customize, and then click the Commands tab. Locate Help in the categories, drag the Next Topic button somewhere on the icon bar, and then click Close. Now you can move through the tutorial screens. Figure 2-3.[View full size image] 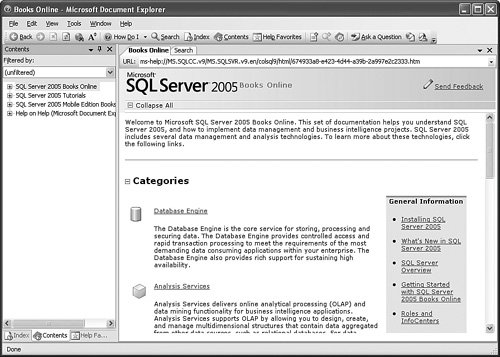
The last tab, shown in Figure 2-4, is the Help Favorites tab. When you are reading any topic, you can right-click in the reading pane and select Add to Help Favorites. The link that you can see in the top bar is stored with a friendly name in this tab. Figure 2-4.[View full size image] 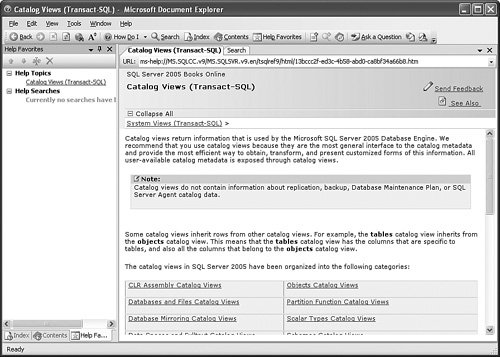
You can search Books Online by clicking on the Search tab in the reading pane. Enter the search information and Books Online will search local sources as well as other systems on the Internet, if you are connected. As you can see in Figure 2-5, this system is not connected to the network and so cannot browse those sources. You will discover much more to Books Online as you use it, but I want to point out two more features. The first is located in the icon bar and is called How Do I…. This button has two modes. If you click the button graphic, the results default to the SQL Server engine. If you click the pull-down arrow, you can select another feature, such as Notification Services. When you click the button, you are taken to a section of Books Online that lists references to common tasks and topics. Figure 2-5.[View full size image] 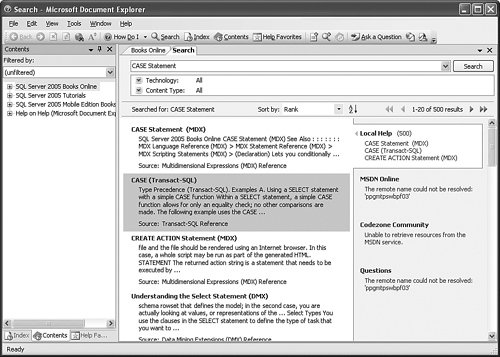
Another useful feature is called Ask a Question. If your system is connected to the Internet, you can post a question to the user forums on SQL Server 2005. This is a useful feature, and I have found the community to be responsive. Just remember when you become a guru to give a little information back to those starting out. SQL Server Configuration ManagerInstalling the tools on a server or client installs the SQL Server Configuration Manager. It performs two major tasks: It controls the state of the services running on your SQL Server and configures client and server protocols in the network layer of SQL Server. When you first open the Configuration Manager tool, you are placed in the service-control area, where you can see which services are running on your system and control them. In Figure 2-6, you can see that I have the database engine with SSIS installed on this system, so the services I am showing are SSIS, the Microsoft Full-Text Search engine (msftesql), the default instance of the engine (MSSQLSERVER), the SQL Server Browser that allows server information enumeration, and the SQL Server Agent, which performs automated tasks. If I had more options installed on this system, I'd show various other services here, too. Figure 2-6.[View full size image] 
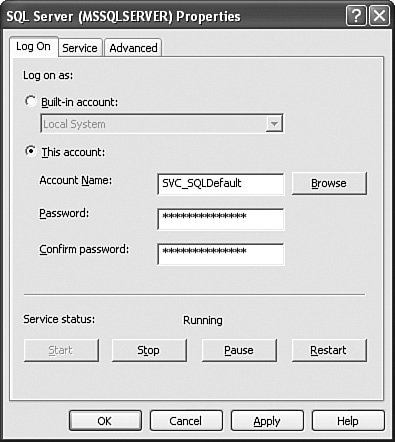
Each instance will also get another service for its engine, in the format MSSQL$InstanceName. Notification Services also gets an instance name, with NS being the prefix for the default instance and NS$ for each instance after that. SQL Server Agent also follows this instance-naming convention, with SQLAgent prefixing the default and SQLAgent$ for the rest. Right-clicking any object brings up a menu for that item that allows you to stop, start, or in some cases, pause, resume, or restart the service. In the case of the database engine, pausing the service has the effect of completing running tasks but refusing any new connections. You will not see this used very often in the field, especially on a production server. Another option on the right-click menu of an object is Properties. You can see that in Figure 2-7. Figure 2-7.
This menu sets the startup parameters for the service and allows you to set the logon account. You can use the System account, which has full machine privileges but not e-mail, share, or network permissions, or you can use a user account. My preference is to use a user account with appropriate permissions so that I can send mail, connect to shares for backups, and so forth. I normally use the same account for the SQL Server 2005 Engine, Agent, and Notification Services, but I use a different one for each instance. That allows me to set different permissions for each instance, based on what I want them to be able to access. As I mentioned in Chapter 1, this account does not need to be an administrator. Other tabs on this panel include Service, which displays the file paths and other information, as well as the service startup mode, and Advanced, which changes based on the object you are looking at. In the case of the SQL Server engine, it sets the startup parameters, which tells the server to start up in single-user mode, secure mode, or multi-user mode (the default). You will also find version numbers, clustering indicators, and more on this tab. On some objects, such as SSIS, there are no advanced parameters at all. Once you close out that panel and return to the Configuration Manager and expand the tree, you can see the protocols for the server and client. If you have installed SQL Server and tried to connect to it from a client, you will find that the server does not answer. When you walk to the server and connect from there, it works fine. The reason is that by default the only protocol SQL Server enables on this Edition is Shared Memory, which does not use the network. TCP/IP is not enabled, which Microsoft calls "secure by default." That varies, as I mentioned in the last chapter, based on the edition of SQL Server 2005 you've installed. Figure 2-8 shows the default settings for the Developer Edition. Figure 2-8.[View full size image] 
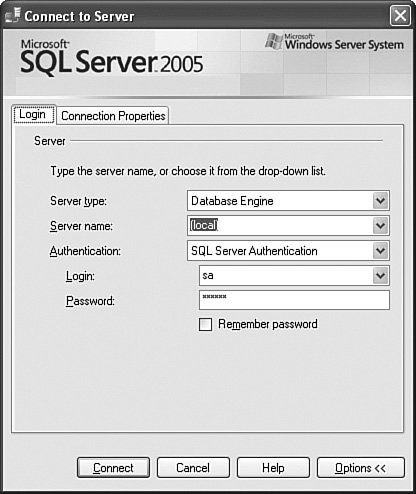
You can enable any protocol from here by right-clicking it and selecting Enable. Remember: Do not enable any protocols you do not need. SQL Server Management StudioWe will spend a lot of time in the SQL Server Management Studio, so I use this section to introduce the basics of this interface. In the "Take Away" section at the end of this chapter, I show you how to perform a few representative tasks that you can try on your own development or testing server. Microsoft has made sure that there is a consistent interface look and feel between SQL Server Management Studio, the Business Intelligence Developer Studio, and Visual Studio. The idea is to be able to share the same code base for an integrated development environment (IDE) and the management tools for SQL Server. You will find yourself working with Management Studio in a couple of ways. The first is to create a project, which is a connection, a group of T-SQL and other files used in a larger setting. The other is to type in a query or run an immediate command. I will be working in the both modes in the "Take Away" section, so in this section I will show you the basic parts of the tool that you will be working with. The SQL Server Management Studio is installed by default when you install the server software, but you can also install it on a workstation using the same installer and selecting the Client Tools option when you get to that selection panel. Most administrators install all the client tools on their local workstation and then manage their servers from one location. You can launch the SQL Server Management Studio from the Windows Start menu under the SQL Server 2005 item. When you launch it, you are asked to log in to a server. You do not have to log in to a server to use the tool, but none of the commands you type will execute until you do. In Figure 2-9, I am connecting to the default instance of SQL Server 2005 on my test system. I have used the word (local) to indicate the local system. I have also set the credentials to the sa SQL Server account and provided the password for that account. Figure 2-9.
You can connect to older versions of SQL Server as well as SQL Server 2005. To connect to a server, you just type its name in the first box. I have entered the (local) address, which directs the connection to the machine I am working on. I have also expanded the options for this connection so that you can see the connection tab where you can set things such as timeout limits. If you are working with something other than the default instance of SQL Server 2005 as I described earlier in this chapter, you type the name of the server where the instance is located and then the name of the instance, separated by a backslash, like this: TheServerName\TheInstanceName You can connect to as many servers as you like from this tool, and if you are going to connect to the same systems fairly often, you can register them. When you register a server, SQL Server remembers the connection information, and the security information can be saved, too. If you are in a large enterprise or are administering lots of servers, you can also group the connections into a logical name set. I cover the security options in Chapter 4, so for now just select Windows as the authentication method. Before I explain the parts of the screen in SQL Server Management Studio, I will take a moment and explain how to register a server. In this example, I have not connected to a server, but instead I have clicked Cancel on the main login panel. That drops me into the Management Studio with no connections. To register a server, you can press Ctrl-Alt-G or click on the View > Registered Servers menu item. A small panel will open on the upper-left part of the Management Studio called Registered Servers. The top object within that area is used to connect to the database engine of a server instance. If you connect to a business intelligence instance, you will see another object below this one. To register a new server, right-click the Database Engine object and select New and then Server Registration. Type in the appropriate connection information and any description text, and then click the Test and Save buttons. You can also right-click the server's registration after you create it and change its properties to have a friendly or descriptive name. To group your servers, follow the same process and select Server Group rather than Server Registration on the New… menu item. After that, you can move server registrations into the group by right-clicking the registration name and selecting the Move to… item or by right-clicking that group name and adding the server from there. You can also nest groups within groups. When you connect to a server, a few panels display. For those familiar with the visual tools found in other Microsoft development environments, this one works much the same way. Depending on whether you have registered a server, you will have two or three. The panels on my system are shown in Figure 2-10. Figure 2-10.[View full size image] 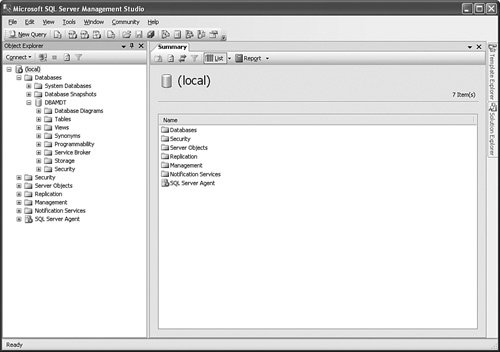
The environment is arranged in the typical menu bar, icon bar, and main window arrangement. You can access the menu by pressing the Alt key once or clicking it. You can hover over any icon to see its meaning, and clicking in any panel gives it the focus. By default, you will see the Object Explorer on the left. This panel allows you to navigate through the various objects on the server you have connected to. At the upper-right side of this panel, and even on some others, you will see three small icons. The first is a down-triangle, which provides a drop-down menu that will set the location for that panel. You can have it float, meaning that it appears as a separate window on the Management Studio. If you do that, you can dock it again by using the Window menu item. Move the smaller window around until the shading indicates where it will dock. You can also set the window to use tabs, which is useful if you need more screen real estate. Next to the position menu is a push pin, which sets the auto-hide feature. With the pin "pushed in," the panel is always displayed. With the pin "pulled out," the panel slides away when you type or click another part of the screen and leaves a small tab to get it back. If you do not have multiple monitors or a huge screen with great resolution, this is usually a good way to work. In the last graphic, I have two tabs on the right set up this way. You can open subobjects in the Object Browser by clicking the plus sign next to them. To perform an action on an object, right-click it. The menu items that appear will either have three periods beside them (called ellipses) or not. If they do, there is another set of selections to answer. If not, the action displayed on the menu happens with no further dialog when you click it. As you click any object in the Object Browser, you see the information about that object in the right side of the screen, starting with the Summary panel. This part of the screen is tabbed by default, so as you click objects and perform actions on them, tabs open here to show the latest result of what you are working on. Its display is context sensitive, so the view depends on what you clicked in the Object Browser. Selecting the View menu item displays all the panels you can open. You have already seen the Object Browser, the Summary panel, and the Registered Servers views. The next view, Template Explorer, shows predefined T-SQL statements to perform common tasks that you can use and even add to. To use a template, just double-click the item that matches what you want to do. If you are not already connected to a server, you will be prompted to connect. You can click Cancel and still view and edit the script, but you cannot run it until you connect to a SQL Server instance. The text shows up in a tab in the middle panel. As you explore the template, you will notice that there are some items that have less-than and greater-than symbols (< >) around them. These are the variables that you need to replace to make the template work in your situation, such as a table name or other parameter. You can work through the script to find and replace them, or you can click the icon (in the icon bar) that looks like an A-to-B conversion, or press Ctrl-Shift-M. The last two options bring up a panel where you can enter all the variables at once and will replace all the parameters for you throughout the script. After the template is filled out, nothing happens until you press F5 or click the green triangle in the icon bar. I explain a little more about that when I discuss queries in the "Take Away" section. To create your own templates, right-click the SQL Server Templates object in this panel or any of the folders beneath them, name the template, and then type the T-SQL you want to save. These templates are local, so they will only exist on the system where you are typing them. We will use templates shortly. For now, I will close the Template Explorer view on my system and bring up the Project Explorer view from the View menu. A project is a collection of connections, scripts (which are recorded T-SQL statements), and other files grouped together under a single name. I explain how to create a project in the "Take Away" section. What is important to note here is that when you invoke this view and open a project, you will see another object browser on the right side of the Management Studio. This panel has Connections, Queries, and Miscellaneous folders where you can store the objects associated with your project. Closing that panel often leaves a Properties view. You can also invoke a Properties view from the View menu. Property views are panels that allow you to change various settings based on the object you are looking at. The Properties page has items on the left and values on the right. If an item is grayed-out, you cannot alter that setting. The next item on the View menu is the Bookmark Window. You can also press Ctrl-W to access this panel. When you are working through large code windows, it can sometimes get a little confusing. You can place a comment in the code either by using and in-line comment using two dashes () on a single line or by a block comment, where you enter a slash and then asterisk to start a comment and an asterisk and a slash to end it, like this: /* This is a block of comments, and the text inside does not execute. In fact, it will turn a different color inside the Management Studio. */ You can then search through those comments to locate notes about them.
Using block comments is usually the safer method, even for a small comment. Dashes only cover the current line, and when you ship your scripts around, it is fairly easy to have a line feed inserted where you did not expect. With a block comment, that is not a problem. An alternate way of marking sections of your code is to use a bookmark. To create a bookmark in your code window, position the cursor anywhere on that line and press Ctrl-K. To view or traverse these bookmarks, open the view (Ctrl-W) and click any bookmark. You can even create folders for these bookmarks. The last view I cover here is the Toolbox view. The Toolbox panel opens as a blank slate and allows you to put common maintenance tasks in icons so that you can arrange them as you want. To add an item to the Toolbox view, right-click inside the panel and select the Choose Items… menu option. You will get a list of items to add to the toolbox. To close out our tour of the SQL Server Management Studio, I explain a few of the settings you can change to work within the environment. To view and change settings, access the Options item from the Tools menu. The first panel changes general environmental options such as window behavior. You can also change the fonts and colors for the Management Studio. You normally will not have to do that because the Management Studio automatically uses a separate font and color of various text states. For instance, comments are shown in green and in the Courier font. You will find yourself relying on this color coding quite a bit; so if you are familiar with another color scheme, you can change these settings to match what you are used to. Another useful set of options is in the Help section. You can have the help engine search the local files and even the Internet when you invoke it. You can set many other options, from adding source control systems such as Visual SourceSafe to the default output for query results to grid, text, or file. I revisit these options in later chapters as we need to change them. Command-Prompt UtilitiesYou can use quite a few command-prompt utilities in SQL Server 2005. I cover the two primary tools you will use: sqlcmd and bcp. I also list other utilities and cover their use and parameters as I demonstrate them throughout the book. sqlcmdThe sqlcmd utility is a command that is similar to the Query window in SQL Server Management Studio. You can connect to one or more servers, run a query, and receive the results, all from the operating system command line. It is a bit more flexible than the Management Studio because you can create script files and pass them variables and call those scripts using a single statement. The sqlcmd utility uses the SQL Native Client to connect to the server, so you have access to the CLR functions of SQL Server 2005, too. Other scripting languages, such as VBScript, can call the sqlcmd utility and even receive results from it. There are two modes of working with sqlcmd: interactive and scripting. To use the interactive mode, enter the sqlcmd command at the operating system command line with the connection information for the server. For the scripting mode, call the same command with the switches that run a script. I show you both in a moment. In the interactive mode, you can enter commands, separated by the word GO and press Enter until you are done. When you have finished, type the word EXIT and you will leave the utility. In the scripting mode, your code runs and then exits the process.
Throughout this chapter and the ones that follow, I will uppercase certain words, such as GO and EXIT. Unless your system is installed with the case-sensitive option, you don't have to do that. Even then, the only case sensitivity is in the data, not the commands. I capitalize all letters in a reserved word to make the scripts more understandable. If you are using the utility on the system where SQL Server 2005 is installed, you can just enter sqlcmd from the command line and then start entering commands. I have done that on my test system in Figure 2-11. Figure 2-11.[View full size image] 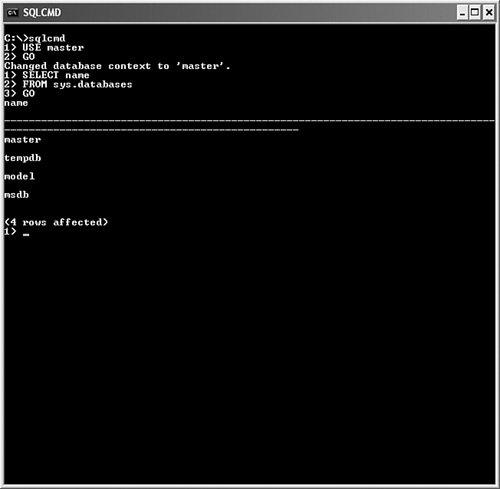
There are quite a few switches with the sqlcmd utility. You can get a readout of them by typing the following command sqlcmd -? On my test system, you can see the output shown in Figure 2-12. Figure 2-12.[View full size image] 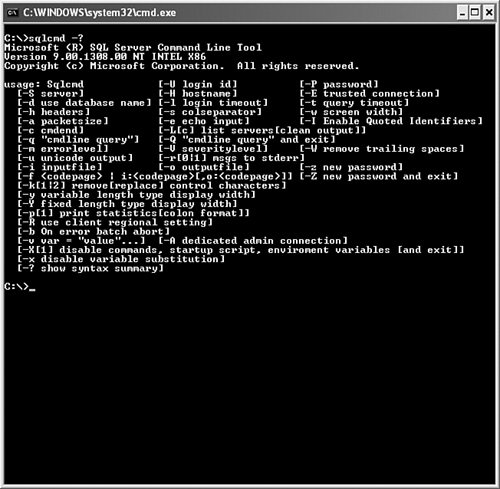
You will not always need all these parameters, so I show you the basics here. I return to this tool throughout the text and demonstrate a few of the other parameters. For now, let's take a look at a simple example that runs a query and shows the databases installed on this system: C:\> sqlcmd -S (local) -E -d master -Q "SELECT name FROM sys.databases" name master tempdb model msdb Let me explain these switches. Unlike most Microsoft Windows paradigms, case matters. A small letter in the switch does something differently than a capital letter. The -S specifies the server and instance name. I have set my parameter to (local), but when you are using sqlcmd on the server itself, this really is not necessary. The -E parameter enables trusted security, meaning that the Windows account is used to access the server. Again, if you are using this command from the server where SQL Server 2005 is installed and your Windows account is allowed into the server, you do not need to use this parameter. If you are not using trusted authentication (more about that in Chapter 4), you need to pass both the -U (username) and -P (password) parameters. The -d parameter sets the database that you want to run the query against. The -Q followed by quotation marks contains the query you want to run. As I mentioned, the case of the parameter is important because an uppercase Q runs the query and returns to the operating system, and the lowercase q runs the query and stays in the sqlcmd interactive mode. If you make a mistake and use the small q, just type EXIT to leave. A script file, as explained earlier, is just a text file of T-SQL commands. Without delving into a great deal of programming, if you place a GO between blocks of T-SQL code, the block will run as a batch. A batch in code is similar to a transaction. Batches can also limit the amount of data that is read, inserted, updated, or deleted at one time. Keeping the batch size small allows best use of the transaction logging process. There are two methods of running a script. The first is to use a sqlcmd command, which is a colon followed by a letter. Several commands are available (see Books Online for a complete list), but the command to read and execute a file is :r. In the interactive mode, you can read and run a file by entering the filename after the :r, shown in Figure 2-13. Figure 2-13.[View full size image] 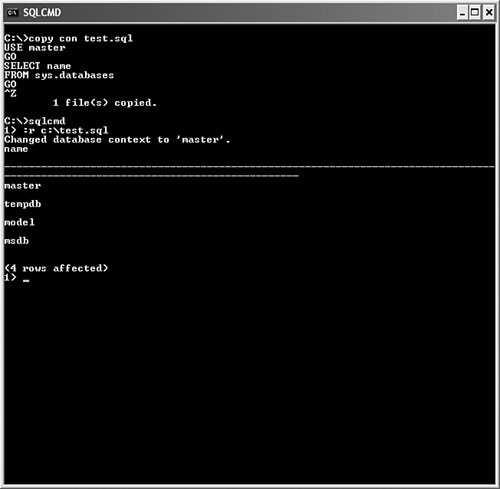
In this example, I have created a simple script at the command line and then run sqlcmd in interactive mode. I then invoked the :r command to load and run the script. You can run a script without having to use interactive mode, too. All you have to do is add a different switch instead of the -Q parameter I demonstrated earlier: C:\> sqlcmd -S (local) -E -d master -i C:\test.sql The -o switch outputs the results of the query to a file rather than the screen. To send the results of the preceding query to a file called results.txt, use this command: C:\> sqlcmd -S (local) -E -d master -i C:\test.sql -o C:\results.txt bcpThe bcp (bulk copy program) command is used to copy data from a table, view, or query to a file or to insert data from a file. Along the way, you can specify various formats for the file, from comma-separated values to a native format, sort of like a backup. The text file can be used with just about any other program, but the native type only works with SQL Server 2005. The bcp utility moves data very quickly. It is one of the fastest methods around to move data in and out of SQL Server. Once again, there are many switches, and like the sqlcmd command, they are case sensitive. Although the switches do not match the sqlcmd utility, the -? works the same way, as you can see in Figure 2-14. Figure 2-14.[View full size image] 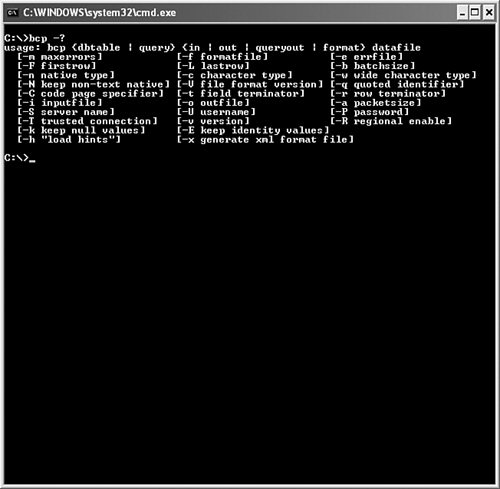
The primary switches you will use at first for this overview are in, out, queryout, -f, and -o. The format of the command to copy data from the sys.databases table to a text file looks like this: C:\>bcp master.sys.databases out "c:\test.txt" -T -c In this example, I have specified the bcp command and then the database, owner, and table that I am after. Next I told the utility which direction the data should goin this case, out. I also specified the name of the file that will hold the data. The -T (notice the uppercase) sets a trusted connection, and the -c sets the column types to the character, or text format. If I you use -n, the file will be stored in native mode, which is a binary format only SQL Server can read. To export data using a view, you just specify it as if it were a table. To export data using a query, use the queryout switch, which looks like this: C:\>bcp "SELECT name FROM master.sys.databases" queryout "c:\test.txt" -T -c The -f switch tells the bcp utility to use a format file, which is just a text file that allows you to use other column names and do field mapping. Here are the first few lines from a sample format file I created: 9.0 4 1 SQLCHAR 0 15 "\t" 1 Name "" The first line is the version of SQL Server (6.5 = Microsoft SQL Server 6.5, 7.0 = Microsoft SQL Server 7.0, 8.0 = SQL Server 2000, and 9.0 = SQL Server 2005), and the second line sets the number of columns. The next line starts with the column number in the destination, then the data type, which in this case is SQLCHAR, or text. (For a list of all data types, see Books Online under the topic of "Specifying File Storage Type by Using bcp.") Next comes the prefix length, which can be 0, 1, 2, 4, and 8. For the most part, you will use 0. The number 15 in this example represents the length of the field. After than comes the field terminatorin this case, a tab (\t). The other legal values here are comma (,) and a newline (\r\n). The rest of the file contains more lines that specify each column in the same way. The 1 that follows the "\t" is the number of the column in the source data, and the word Name in this case is what the column will be named in the destination. The final quote signs indicate the collation. Values here are the same as in SQL Server, such as SQL_Latin1_General_CP1_CI_AS. There is a lot of tweaking to be done when you use one of these files. Books Online has a full rundown on the options and also shows more sample files. There is also an XML version of this format file that will "shred" XML documents into the database. I deal with that in another section of the book. Along with sqlcmd and bcp, other useful command-line utilities include those listed in the following table.
SQL Server ProfilerSQL Profiler can capture and display any or all of the statements that are running on your server for a given period of time for the database engine (and the business intelligence engine). You can save this information out to a file or in a table or you can get immediate feedback as you use the tool. SQL Profiler is useful for tracing problems in code, identifying long-running queries, or even just finding out how the statement is processed by the server. It lets you capture events that happen on a SQL Server and filter them by various constraints. You can run Profiler on the server or from your workstation against a server. I follow the same process here as I did in the previous section on the SQL Server Management Studio, showing you a high-level view of the interface, with an application in the "Take Away" section. We use Profiler again in Chapter 5. You do not have to be a system administrator to run Profiler. You have a special permission that you can grant to allow users to run the Profiler. It is important, however, to grant this permission with caution. Anything that is not encrypted is visible to Profiler. SQL Server 2005 passwords and integrated security passwords are encrypted, but a developer might choose to implement security by passing names and passwords to a table in SQL Server, and that would be visible to the Profiler. You can find SQL Server Profiler on the Start menu under Microsoft SQL Server 2005 > Performance Tools > SQL Server Profiler. When you first open the tool, you are presented with a large blank screen. Capturing a group of events for a period of time is called taking a Trace, and the output of the session is called the Trace. To try it out, click on File and then New Trace. Connect to a server, and you are presented with the screen shown in Figure 2-15. Figure 2-15.[View full size image] 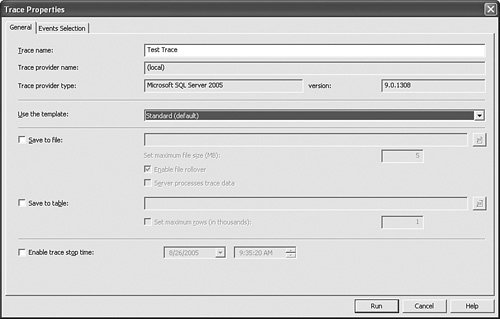
In this tab, you name the trace and set where the output for it will go. If you do not choose a file or table, your trace will only capture data for display on the screen. You can save the data after it is captured if you want. You can also set the trace to stop at a certain time. This is useful for tracing for a long period of time. There are also ways of automating traces, which I explain later. The first tab also contains the choice of Templates that the trace will work with. A template is a saved group of settings that perform common tasks. For this example, leave this set to the default template, which captures login and logout events as well as T-SQL statements. The Events Selection tab, shown in Figure 2-16, groups the events you can capture into your trace. You can select the items you would like to capture, and you can apply various filters to restrict what you collect. As a rule, you should collect only what you need, so most filters remove things such as the Profiler itself, system calls, and so forth. Figure 2-16.[View full size image] 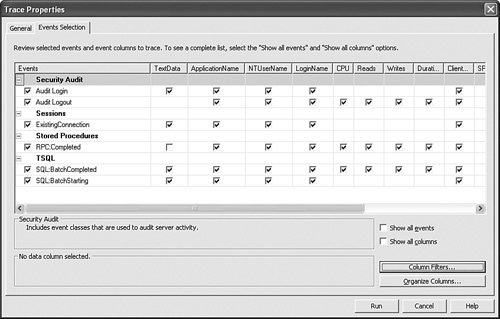
Leaving the defaults here, all you have to do is start the trace is to click the Run button. After I started this trace, I switched over to the SQL Management Studio and ran a simple query. I logged out of Management Studio and then stopped the trace. You can see the results of my session, shown in Figure 2-17. Figure 2-17.[View full size image] 
Even though I simply connected and ran one query, you can see there is quite a lot of activity captured. Without the filters built in to this template, there would be even more. What I have highlighted in this graphic is the connection environment information sent to SQL Server 2005 by the client (in this case, Management Studio). Even this connection information is valuable, because it determines how the server will process the query and return the results. Clicking the SQL:Batch Starting statement that has my query shows what was sent to the server, as you can see in Figure 2-18. Figure 2-18.[View full size image] 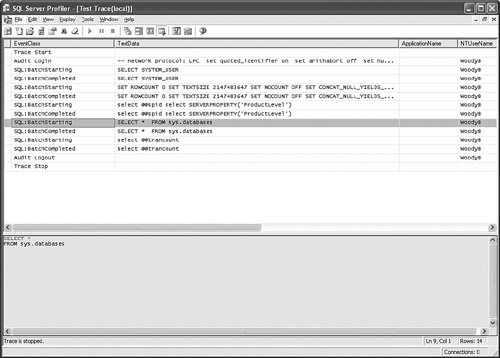
Off to the right of this panel (not shown in this graphic) are other columns that show the start time and duration of an event, the name of the user, the workstation name, and so forth. Filtering for these columns allows you to see long-running queries, as I explain in the "Take Away" section. If you did not set the data to be captured directly to a file or table, you can save the data on your screen to either of those or even an XML output. Saving the trace allows you to evaluate it later or even "play it back," by running the trace against the server. This makes Profiler a testing aid in addition to a monitoring tool. You can also save the settings you have adjusted as a new template, and reuse those settings later. |