Take Away
There are several uses for Reporting Services, including processing application reports, merging data from multiple sources into a single view of data, and, as we have done in this chapter, system status reporting. But one of the most powerful uses of this technology is as a destination for Business Intelligence data. In the next chapter, I explain how all the features that SQL Server 2005 provides come together with Analysis Services to enable a comprehensive, strategic view of the data locked in your application databases. One of the key components of that system is the ability to show everything from metrics that show how an individual site or plant is doing against a defined requirement, called a Key Performance Indicator (KPI), all the way out to a reporting showing the results of multidimensional analysis on the entire organization. In this section, I explain how you can use Reporting Services as the "front end" of a Business Intelligence (BI) layout, called a landscape. I create a simple report using a wizard, much as I showed you earlier in the chapter, but with a few changes for an Analysis Services data source. The design for a Reporting Services deployment changes for a BI landscape. Although you still want to follow the guidelines for evaluating the load on the Reporting Services servers from the database and source data standpoints, the source data you are pointing at with this application involves consolidated, aggregated data rather than multiple text files, Excel sources, and the like. You are much more likely to use a single server to access the data for the reports. In fact, you may not connect to a database server directly at all. In a BI layout, you will more often use the Analysis Services server to provide data to the report. In this case, I use a wizard that connects to an Analysis Services cube of data. In the next chapter, I describe creating the cube. Because you do not have the cube I am working with configured on your system, I explain each step as I go. In Figure 9-50, I have opened the Business Intelligence Development Studio and selected the Report Services Project Wizard. I will name this project Cube Access. Figure 9-50.[View full size image] 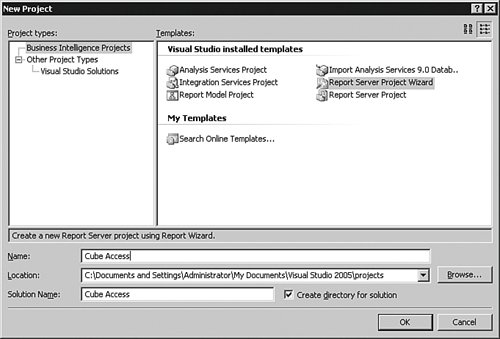
In the first few steps of the wizard, I am asked to select the data source, just as we did in the report project earlier in the chapter. This time, however, I need to pick the Microsoft SQL Server Analysis Services type of source. I will name the data source AW Cube. In Figure 9-51, I enter the Analysis Services server name and select the cube I deployed from there. Figure 9-51.[View full size image] 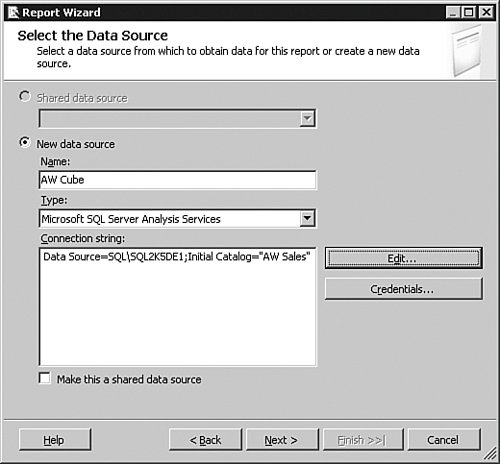
I click Next to design the query and then click the Query Builder button. The data selections shown in Figure 9-52 are much different than what we dealt in relational data. For now, I make the selections to show a promotion name that ran, along with the date that items shipped, as well as the revenue. I am trying to show a correlation between the promotions that we paid for and the return we received. Figure 9-52.[View full size image] 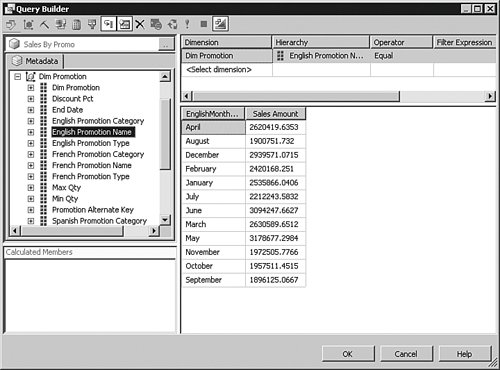
In Figure 9-53, I select the Matrix type of report, and then lay out the fields I chose in the last step. Depending on how the users want to see the data, you can set the columns and rows to your liking. In my case, I have set the promotion across the top and the dates on the left, with the dollar figures in the detail area. Figure 9-53.[View full size image] 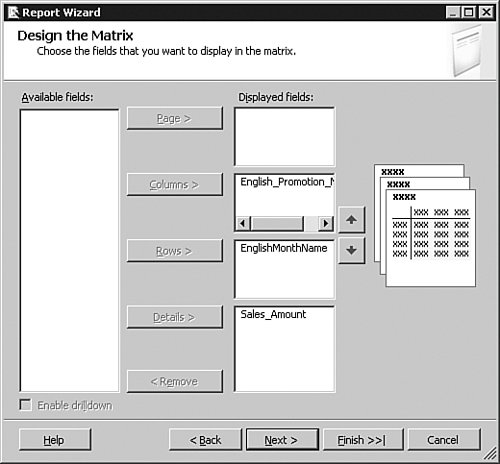
The next few screens set the formatting and layout, and for this example I take the defaults. On the last entry panel, I am asked to set the server name and a folder to hold the report. I set the names there and then finish the report. When I am dropped back in the designer, I build and then deploy the report. From the report shown in Figure 9-54, it seems that the Volume Discount 11 to 14 promotion seemed to be the big winner. More analysis is warranted to ensure that other factors did not play a big part of the increases shown, but that is the point of a good BI system: It always forces more questions. Figure 9-54.[View full size image] 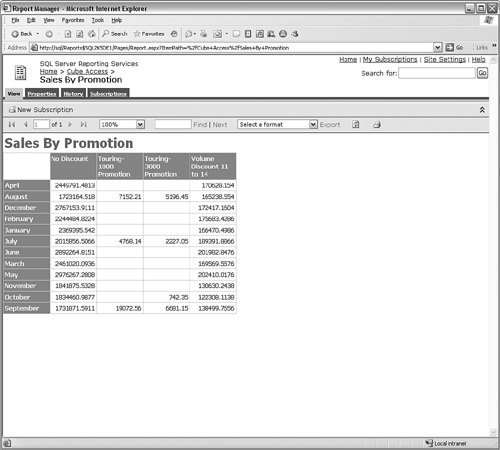
|


