
Whether you are looking at a system to determine growth patterns, locate a problem, or determine where a performance bottleneck is, you first have to know where to look. Fortunately, even though most enterprise systems are complex, computers have only four basic parts: processor(s), memory, storage, and network interfaces. There are a lot more components in the hardware architecture of a system, but they all affect or are affected by one or more of these parts.
Growth occurs as an increase in storage space and memory use and shows up as more traffic on the network interfaces and greater load on the processors. Problems occur in one of the four parts of the system, or more often in a combination of them. Bottlenecks follow the same pattern.
All of these components change over time. But before you can see a change, you have to know either what the system is supposed to look like or what it looked like in an earlier state. That is where a baseline comes into play.
Setting a Baseline
You may be fortunate enough to start with a "fresh" system, one that you have built yourself with lots of planning, an adequate budget, and enough time to implement. More probably you inherited an incorrectly sized system that was rushed into production and whose use has grown far beyond its original purpose. Either way, monitoring begins with a baseline. A baseline is a set of measurements from some earlier point in time, preferably right after you build and configure the system.
The baselining process follows a simple outline:
Find a representative set of measurements that move with activity. Understand the metrics associated with those measures. Set up a controlled amount of the activity. Collect and record the metrics.
Although the outline is simple, the steps to implement it can become quite complex. The reason is that most applications have multiple interactions that flow through various paths. In addition, the interactions often do not correlate in a linear fashion. For instance, in a given application, memory does not climb at the same rate as connections.
To accurately monitor a system, you need a thorough understanding of the application and platform architecture to find representative measurements and the metrics associated with those measures.
To monitor for growth or to find issues, you can use your test or production environments, but you will find that the best way to monitor for performance is in a controlled environment.
A complete set of baselines includes a stasis test, where the system has no connections; an in-use test, where an average load is placed on the system; and a stress-test, where the system is placed under heavy use. The basic idea in measurement is running several identical tests and taking the average of the metrics you collect. That forms the first part of your baseline.
Baseline metrics belong in permanent form, just like your security audit. Once again, I advocate placing the metrics in the DBAMDT database or something like it and then creating permanent reports from there. Whether you store the data electronically or not is up to you, but you need to compare lots of numbers during a performance-tuning exercise, and the electronic format favors that process. In any case, you have to record the data somewhere.
What to Monitor
Earlier I mentioned that there are four parts in a computer system, but none of them stand alone. The processor is affected by its architecture, cache, the bus, and even the motherboard it is connected to. Memory is also affected by architecture and is connected to a bus and the motherboard. Network cards are affected by the bus speed and caching. Probably the most complex part is storage, also called I/O. In fact, storage is often called a subsystem because it may not even be controlled directly by the server.
Taken together, these affected parts form the major components of the system. To find performance problems or functional issues, you are looking for any deviation from the baseline or other standard within the components. When you locate those deviations, you can break down each of the parts of the system, from the client systems forward, focusing on any parts that specifically affect the SQL Servers. You can then trace the components to the parts they affect and drill down on the activity there. It is a matter of starting with the general and moving down to the specific.
Consider an application that has a full client installed on a workstation connecting directly to SQL Server 2005. To find a problem, inspect the interface the client software uses, the connection methods to and from the server, and monitor the four primary parts within the server that the client activity produces.
When you troubleshoot, monitor in conjunction with the application suite, taking combined metrics on both the client and server(s) and performing tests in tandem. It is important to combine the testing because the problem might exist in two places at once.
For performance tuning and baselining, you can monitor SQL Server and its affected parts. In both cases, you should monitor two classes of objects: platform and database activity.
Monitoring the platform involves more than just collecting database metrics. You also need to record information about the hardware, operating system, and other layers on the system that affect the growth or performance of the system, because the two are related. In this section, I show you how to use a combination of operating system utilities and mechanisms in SQL Server 2005 to monitor both kinds of activity. You can also use third-party software hardware solutions to measure platform activity, but I stick to the tools installed by default.
Monitoring database activity is easy to do but difficult to interpret properly. There are several ways to monitor database activity, from embedding trace code in the application to using tools on the server that watch the activity and report on it. Interpreting the data you receive from the tests needs to be done in conjunction with the development team because only they know what the application is doing and why.
To develop a list of the specific objects to monitor, focus on the purpose of the monitoring. The primary reasons you are monitoring the system is either for growth prediction and management, activity as it relates to performance, changes to the structure (Data Definition Language, DDL), or to find and correct problems or issues. Most of the monitoring techniques can be used for multiple purposes, but monitoring for growth is slightly different from monitoring for performance, and so on.
Growth
One of the most common purposes of monitoring is to measure and predict growth. This exercise requires a baseline, taken when the system is new or when you inherit it. The baseline provides the "starting point" for growth predictions. Monitor each system and collect metrics from the four categories of parts: processor, network interface, storage, and memory.
Specificlly, you want to monitor the following objects and collect their values.
Object Class | Value to Capture |
|---|
Processor | % of utilization | Network | Traffic, total in bytes | Storage | Total transfers, in operations or blocks | Memory | Megabytes or gigabytes in use | Database | Size (for each database) |
By taking a snapshot of these items and tracking the same measurements over time, you can begin to plot a growth trend. That much is obvious, but the important decisions are how often to take the measurements and how many to take.
If you are not sure where to start, monitor with a short interval (5 or 10 seconds) for 24 hours, for a week. After that, take the 24-hour measurements once a week for a month, and then once a month for two months.
With those numbers in hand, first check the daily range. Arrange the numbers by time and then create a graph from them. The numbers show a trend, either flat, up, or down. If the graph shows a general trend upward, arrange the numbers from lowest to highest values. Plot the points again along a graph and evaluate how often they change. You might see a consistent growth pattern or one where the numbers rise in slopes and plateaus.
If the numbers rise in a predictable pattern in an upward trend, take the first measurement of the week, the last measurement of the week, and predict from that pattern what the growth pattern should be for the next three weeks. If your predictions are correct, they will match the weekly numbers you captured after the daily measurements. Follow the same pattern to test against the monthly numbers.
If the metrics originally show a flat line, you need to measure for a longer period of time. Measure weekly, but for three months or more. Follow the same process as above, using the weekly trends to predict the next weeks and months.
If the measurements show a downward trend, chances are that the system was experiencing a significant change or archiving operation. Wait a week and then begin the daily measurements again.
Like all monitoring, this is not a one-time process. You should repeat the exercise each year, testing your theories along the way. The longer you monitor, the more accurate your predictions become.
Activity and Performance
Monitoring to examine activity is usually done to determine performance on an application. You have two choices when you monitor for performance. The first is to record these historical values just as you did in monitoring for growth.
Object Class | Value to Capture |
|---|
Processor | % of utilization, specific to the processes involved in the application | Network | Bytes read and written | Storage | Read and write operations | Memory | Amount SQL Server wants to use and amount SQL Server is granted | Database | Database activities, connections, and locks |
After you have the metrics, organize them by time. Calculate the minimums, maximums, and averages. To make the averages meaningful, you also want to include a standard deviation of the set. The closer the standard deviation is to zero, the more you can trust the average.
To make the performance monitoring meaningful, correlate the metrics with activity. SQL Server makes this process easy, as you will see in a moment. I show you a complete performance-tuning exercise in the "Take Away" section at the end of the chapter.
Data Definition Changes
Another purpose for SQL Server 2005 monitoring is tracking changes on the tables, views, and other objects in the database. SQL Server 2005 includes DDL triggers, and you can capture the changes to another table or even prevent those using triggers. I show you how to do that in a moment.
Issues
Most of the time, you will not be pressured to monitor your system. The only time management or the users will be interested in the results of monitoring involves an issue or problem. When things stop working, everyone is suddenly concerned about the state of the system.
There is not a chart of objects to monitor this time, because the problem might exist in only one part or in multiple parts of the system. A better approach is to use basic troubleshooting skills to find the objects that show movement, and monitor the specific objects that are showing the issue. You can then drill down on the item(s) that caused the problem. Let's take a look at that process.
Troubleshooting
Troubleshooting skill is one of the most valuable assets you have as a DBA. The process is not difficult from a conceptual standpoint: Evaluate the symptoms and determine the cause of the issue. That is easily stated, but hard to implement.
You can make troubleshooting much simpler by knowing a lot about the system. The more you know about how something operates, the quicker you can narrow down the places you need to look for interactions that might be causing the problem. So, the first tool you have in troubleshooting is educating yourself about how SQL Server 2005 operates. You are doing that now, by reading this book.
Beyond that, it is a process of elimination. Most problems fall into only a few categories. It is either an issue with the physical environment or layout, something on the server, or in the application software. Often, the more complex issues are located in all three areas, and as you fix one you will find the next.
Locating issues within the physical environment starts with running an entirely different application that takes the same path as the one having the trouble. If you see similar problems with a different application, chances are it is in the environment, not the specific application where the problem was reported. Work backward from the database, taking out one variable at a time until you locate the cable, drive, memory chip, or other cause for the problem.
Finding issues on the server platform is easier if you established baselines and performed audits on your system earlier. If you know what the system looked like when it was running correctly, you can compare to the current state to locate the differences. After all, if something was running correctly once before and now it is not, the problem normally lies in the change. Find the change and you will most likely find the problem. If you did not take a baseline, you will need to test each part of the system separately, eliminating the most likely suspects first.
Finding an application problem is the most complicated type of issue to resolve. If there has been a recent upgrade or change, always start there; in a large application, however, it may be that the users have only now exercised an option or reached a threshold where the error occurs.
In most cases, the application will not be the first place that the team looks, so it is up to you to rule out the physical environment and the platform as the cause for the problem. With that established, you can use the SQL Management Studio and SQL Server Profiler tools to show the activity in the database. Depending on the type of issue, you can add counters in System Monitor that will correlate to the problem. Again, it is a process of elimination.
Other problems occur within a mixture of the application and the platform. A prime example of this is in issues involving locks. Locks occur when an application reads or writes data. If an application is reading data, it is important that the data stays consistent, so a lock is taken on the data during the read. This prevents updates to the data until the read operation is complete. This can cause concurrency issues if the code is not written properly.
SQL Server 2005 mitigates this problem by allowing a copy of the data to be held while the original data is updated, so reads do not block writes. Even so, you can still run into an issue where one update depends on another, called a deadlock. In this case, SQL Server picks a "victim" connection and terminates it, sending the application a special signal in code. Developers can watch for this signal and deal with it. If you are experiencing locking issues, monitor with the tools I describe for both locks and deadlocks. Although some locking is unavoidable, excessive locks and deadlocks are good places to start troubleshooting applications.
Regardless of the problem, use the tools and procedures I describe here to monitor what is happening and where it is happening. From there, you can start to answer why it is happening.
Tools
Because SQL Server 2005 is integrated into the Microsoft Windows platform, you can use several operating system commands in conjunction with SQL Server-specific tools to create a complete picture of your server's load. In fact, some SQL Server tools such as SQL Server Profiler actually integrate operating system monitoring tools into their operations.
Several programs included with SQL Server 2005 provide measurements on the platform's activity. Most of these have interfaces that also enable developers to include monitoring within their applications.
Let's examine the tools from the operating system and SQL Server that show you the general and specific activity on the server.
Operating System Commands and Programs
Because SQL Server 2005 runs only on the Microsoft platform, it has a distinct advantage in being able to rely on operating system consistency and its programming interfaces. Many of these are implemented by programs rather than commands, but some commands can show activity that has an effect on SQL Server.
You can also write your own programs for monitoring, even if you are not a professional developer. Using Windows Management Instrumentation (WMI) components in the operating system, you can create simple scripts to show you information about the environment on the servers involved.
The script format is to declare a WMI object and then query it using the WMI Query Language (WQL). WMI scripts to find out information work using classes. Here is an example script that shows the memory for the system using the Computer System class:
' Use the current system
strComputer = "."
' Get the management object
Set objWMIService = GetObject("winmgmts:" _
 & "{impersonationLevel=impersonate}!\\" _
 & strComputer & "\root\cimv2")
'Set the query
Set colSettings = objWMIService.ExecQuery _
 ("Select * from Win32_ComputerSystem")
' Iterate through the objects you are interested in
For Each objComputer in colSettings
 Wscript.Echo "System Name: " & objComputer.Name
 Wscript.Echo "Total Physical Memory: " & _
 objComputer.TotalPhysicalMemory
Next
To show this script in action, enter and save it as a text file called memory.sc and then invoke the scripting engine on it from the operating system command line:
SQL Server also has WMI classes you can use, for both the SQL Server engine and Reporting Services, in addition to others. Search Books Online for "WMI" to find a wealth of scripts that provide information as well as controls for your installation.
Windows Event Logs
The first place within the operating system that you can find SQL Server information is in the Application event log. The event log display program is located in the Administrative Tools area in the Start menu on the Windows server operating systems. You can right-click My Computer and select Manage to locate them on all current Windows operating systems.
Once inside the Event Viewer, locate the Application log. You can filter events by category or date, but I normally do not filter anything out at first. Sometimes the problem or performance information is lurking in places other than SQL Server, so I want to make sure and catch those, too.
Events come in types. The types are Information, which is just as it says; Warning, which indicates there may be a problem or that one is impending; and Error. If you are trying to find a problem, you might want to investigate the most recent Error types, and then work back through the stack with the arrow icons to where the first Warning type dealing with that error occurred. When you locate an item that you find interesting, double-click it.
Figure 5-1 shows that the properties of an event contains when the event happened, the event ID, and the application name that reported the event. The description has whatever the developer wants you to know about the event, so some of these are more robust than others. The event also carries a data payload that you can see in bytes or words.
[View full size image] 
Task Manager
One of the easiest tools to use to show activity on your server is the Windows Task Manager. Right-click your Start menu bar in any blank area and select Task Manager from the menu that appears. Click the Processes tab to show the individual tasks that are running on your system. Check the Show processes from all users box to see the tasks you do not own. I've done that on my test system in Figure 5-2.
[View full size image] 
Your System You can click the headings at the top of the panel to sort the results. On this test system, SQL Server is taking most of the memory, which is to be expected.
You can also sort by the processor utilization to show what is taking most of the resources on the system, but this number is a gross level and not always useful. Switching to the Performance tab shows a graph of the processor use.
At the bottom of the panel shown in Figure 5-3, there are two measures that are important to examine. If the Total value in the Commit Charge (K) area is larger than the Total value in the Physical Memory (K) section, the system is using more memory than it physically has. At that point, the server is paging, which means it is shifting contents of memory to the hard drive and back again. Because physical disks are several orders of magnitude slower than solid-state memory, that factor alone causes an incredible slowdown in performance, and can even cause timeouts that create issues.
[View full size image] 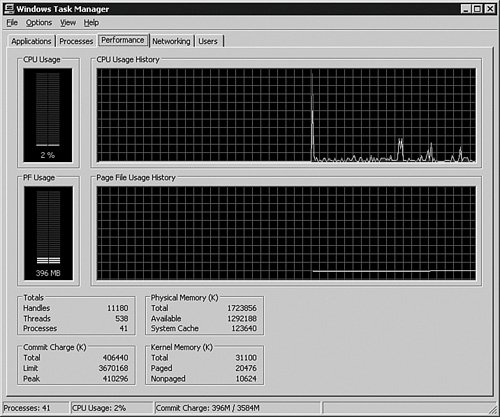
Task Manager is a great place to start when you are diagnosing an issue that is causing a system-wide failure. It illuminates or eliminates areas for you to check.
System Monitor
One of the most useful tools in your arsenal is the Windows System Monitor, which is sometimes referred to as Performance Monitor, from the older version within Windows that looked and operated in a similar way. It works using objects, such as Processor or Memory, and counters, which are things that are recorded about the objects, such as % Used or Total. The number recorded in the counter at a given instant for an object is called a value.
The System Monitor works by reading special registry keys that the operating system controls. Applications, including the operating system, write values to these registry keys every second. This three-way handoff allows the most efficient way to monitor a system.
SQL Server 2005 includes multiple counters that you can monitor, and the advantage is that you can combine measurements into one tool to show cause and effect.
System Monitor has three modes. It can show the values you select in real time, it can collect them and then alert you when an upper or lower boundary is reached, and it can record the information to a log file.
The real-time modes of System Monitor show the values in a graph, a histogram, and report formats. These formats show the state of the objects, but when you include more than a few objects, all of the formats becomes incomprehensible. I normally monitor in this mode only when I have found a particular area to focus on.
Let's take a quick tour of the tool using real-time monitoring. Open the
System Monitor on your SQL Server 2005 system from the Start menu under Administrative Tools, then Performance. If you are using a nonserver Windows operating system, it might be located under a different submenu.
On most operating systems, the tool will automatically show three or four counters loaded and running, as you can see in Figure 5-4. You can click the X in the icon bar to remove those, because you will pick the items you want from a list in a moment.
[View full size image] 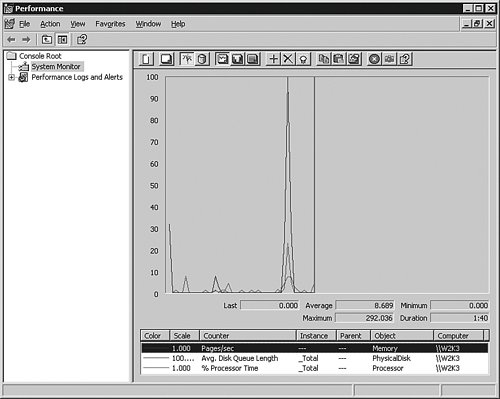
To add objects and then counters to monitor, click the plus sign (+) in the icon bar.
Monitor one computer from another by choosing the Select counters from computer radio button and then entering the name of the server, prefaced by two backslashes. You need to have administration privileges on that system to add the counters remotely, which is why I suggest for this example that you run the tool directly from your test server.
In the Performance object selection, you can choose which objects you want to monitor, and in the selection below that you can select as many counters from the object as you want. You can also choose to monitor all counters; but because monitoring takes a performance toll, it is better to be more specific.
On the right side of the panel shown in Figure 5-5 are the instances associated with the counter. An instance is the count of items within that object, such as the processor number. Not all objects have more than one instance.
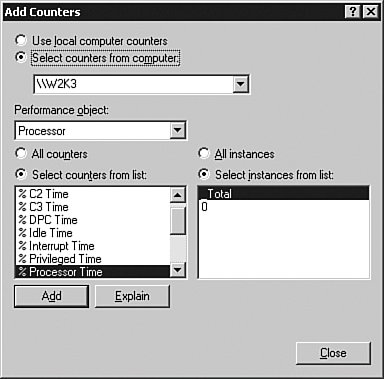
For the CPU object, you could choose to monitor a single processor at a time or the combined total of all processors. This might matter if you discover that a query is not parallelizing as you think it should. The Microsoft Windows operating system takes advantage of symmetric multiprocessing (SMP), but SQL Server is one exception that can use processor affinity, meaning that you can choose to run SQL Server 2005 on a particular set of processors, as I explained earlier in the book.
You can click the Explain button to open a small box with a simple explanation of the counter, but it does not often help much. It is better to review the previous chapters to see how the hardware and operating system affect SQL Server activities to understand what each counter does. You can also search the Web to find more information about a counter, but make sure to cross-reference what you find. Counter values can be interpreted differently based on what they are paired with and how often they are measured.
As you click the Add button for each counter, you will notice the graph begin to move behind the Objects panel. To see some interactions on the platform, add the following objects and counters, taking the default instances of each.
Object | Counter | Meaning |
|---|
Processor | % Processor Time | Shows the percent of time during monitoring that the processor is in use. | Memory | Available Mbytes | Shows how much memory is left. Reverse the number from the total memory to find out how much you are using. | LogicalDisk | % Disk Time | Shows the percentage of read and write time during monitoring. | Network Interface | Bytes Total/sec | Shows how many bytes are transferred in and out. | SQLServer:Databases | Active Transactions | Shows all the transaction activity for the databases selected in the instances area. | SQLServer:General | User Connections | Shows the number of users that Statistics are connected to the server. |
That is enough for now; what we care about at the moment is to see the movement and interplay between objects.
Log in to SQL Server Management Studio and run one query, or just click around in the Object Explorer. Size and arrange the screens so that you can see both of them as you do. Notice the activity levels in the System Monitor as the values of the counters rise and fall.
Change the format in the System Monitor by clicking the button that looks like a bar graph in the icon bar. You will see the view change to a histogram, which shows movement up and down over time. This is a useful view for items such as memory use or drive space, or other items that lend themselves to a "full or empty" kind of display.
Now click the button that looks like a notepad. This view shows a report of the output, but other than spot monitoring, you may not find a lot interesting here. From time to time, I have used the output to show others a particular set of values, especially if they are slowly changing.
Right-click the main part of the System Monitor display and select Properties from the menu that appears. From the Graph tab, you can change the scale, and in the General tab, you can change how often you take the sample.
These instant-feedback views have some limited uses, but to locate an elusive issue, it is more effective to use an alert. An alert is a condition you set when a value goes high or low for a specified period of time. The alert can send a notification or run an operating system command. Using an alert with the notification function alone tells you that the threshold is exceeded. Pairing this function with the sqlcmd command and scripts allows you to watch for a condition and take corrective action.
Let's create an example alert that opens the Windows program called Notepad when the processor exceeds a certain amount of use. For this example, I use 7 percent of processor for 1 second. Change the time or amount as needed on your test system if that is too little a change to monitor for.
Begin by clicking the Performance Logs and Alerts item on the left side of the System Monitor, and then right-click the Alerts object and select New Alert Settings from the menu that appears.
On the first panel, shown here in Figure 5-6, enter any name and description for the alert. Add a counter of Processor, % Processor Time. Set it to alert when it is over 7 percent, or whatever your system shows as a higher-than-average percentage.
[View full size image] 
The sampling rate is how often the system will check for the value. Set the interval for every second and then set the account that will run the alert.
Move to the Action tab as shown in Figure 5-7 to set a program that runs when the threshold is reached. In this example, I have set the action to log to the Event Viewer and to run the notepad.exe application. You could also have the alert start up a recording session of System Monitor, so that you can begin a more in-depth monitoring session automatically only when a problem occurs.
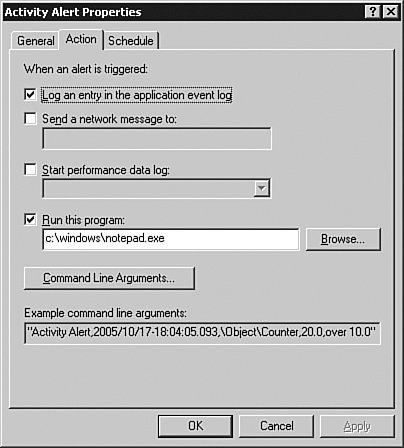
The Example command-line arguments box gives you the text output for the parameters on the command-line version of this tool. Using these parameters at the command line allows you to set up this same alert in text rather than this graphical method.
On the Schedule tab, you can set the alert to monitor at a certain time or on a schedule. Set this to Manual.
Save the alert, right-click it, and select Start from the menu that appears. If the Notepad program does not start, check the Application event log and look for a message from SysMon. It may be that your path differs from the example steps I have here.
Alerts are useful to find a condition and trigger actions based on thresholds. Another useful function of the System Monitor is the Log file function. This function records the values that System Monitor collects and sends them to a file, either in binary format or in ASCII.
To use the Log function, select the objects and counters you want to monitor and designate a file to send the results to. Set a time to start and stop the logging, and you can then read the file into another session of System Monitor using the binary log format, a spreadsheet such as Microsoft Excel when you use a comma-separated value format, or even read either file into SQL Server Profiler.
No matter which function within System Monitor you use, there is an amazing array of counters that you can add for SQL Server. Search for "Monitoring Resource Usage (System Monitor)" in Books Online to see a list of objects and counters broken down by area. Start with the "outer objects" such as Processor, Memory, Logical Disk, and Network Interface. Use the General Statistics object in SQL Server to locate what is moving when you see the issue or are trying to locate the bottleneck. When a counter does not correlate to an issue or performance event, remove it. When a counter does move with these two items, add more detailed objects and counters affected by that area.
You can obtain additional programs in SQL Server or Windows "Resource Kits" from Microsoft that show SQL Server activity as it relates to the operating system. Check the Microsoft SQL Server Web site at www.microsoft.com/sql to find out more about these tools.
SQL Server Management Studio
Although you will not often monitor for historical purposes using the SQL Server Management Studio, it does have features that provide good feedback on a query. Each query you run has several properties associated with it that you can use to track metrics around it.
One of the most useful features within Management Studio is the reporting output that is available from the Summary pane. If that is not showing on your system, click the View item in the menu bar and select Summary. Click the name of the server you are interested in from the Object Explorer, and a button called Report lights up in the Summary tab. There are several reports here that show just about everything that is happening on your server. You can even export these reports to Microsoft Excel or PDF formats. For most descriptive monitoring, the reports here cover everything you need.
Management Studio is also one of the command-based tools used to call System Views and Functions that show historical metrics and metadata, but I leave that discussion for later. Let's examine how you can use the SQL Management Studio to monitor your server.
The Management Object
You can also use two items in the Management item in the Object Explorer to monitor your server. In the Object Explorer pane, drill down to the Management object and expand it.
To get a graphical representation of the activity on your server, right-click the Activity Monitor item and select View Processes from the menu. This brings up a panel similar to Figure 5-8 that contains information on the users and locks in the system. You can double-click any username to see a short output of the query they are running, as well as several columns describing the objects they are accessing, locks, client system names, and much more.
[View full size image] 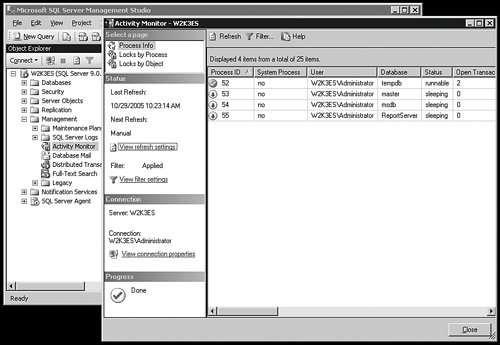
At the upper left of this panel, you can select views that show locks by process or object, and you can also right-click the menu of Activity Monitor to get those same views.
Just above the Activity Monitor is the SQL Server Logs object. SQL Server 2005 tracks a great deal of information about its state in seven "rolling" logs. A new log is created every time SQL Server is started, and the previous logs are renamed in numeric format. If you right-click the SQL Server Logs object, you can click Configure and set the amount of logs SQL Server 2005 collects. The logs show a huge amount of data about the internal workings within SQL Server 2005. They are the first place to start when you have a platform issue involving the server or the SQL Server software.
Open any SQL Server log and you can also view the Windows System, Application, and Security logs. This is useful because you can correlate what's happening in the operating system with events in SQL Server 2005. You can see an example of that in Figure 5-9.
[View full size image] 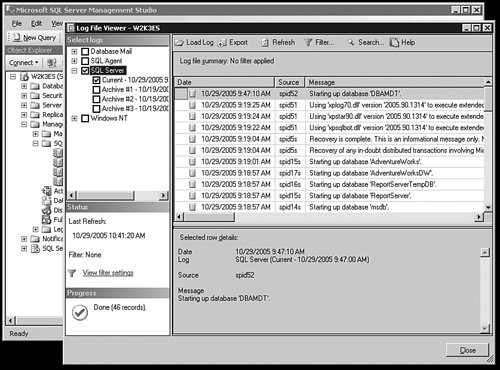
The SQL Server log files, unlike the Windows event log files, are just text. You can read them with any editor, and if you took the defaults when you installed the server, they are at C:\Program Files\Microsoft SQL Server\MSSQL.n\MSSQL\LOG\ERRORLOG and ERRORLOG.n . Replace the first n with the instance you want to examine, and the second n with the number of the log you are interested in. This is useful for automated monitoring using scripts from the operating systems or from other applications.
Query Properties
So far you have seen the activity the clients produce. You can also monitor your own transactions in SQL Server Management Studio by using Query Properties. This is useful for developers because they can snip out the T-SQL from their code and run it here to see what it does.
To see how this works, open Management Studio and then open a query window. In this case, we will use the AdventureWorks database because it has a lot of data already. If you did not install the sample databases, use any database you want, substituting the proper columns and database names where appropriate. Make sure that you click the View item in the menu bar and select Properties. Enter and run the following query:
USE AdventureWorks
GO
SELECT a.LoginID, a.Title, c.City
FROM HumanResources.Employee a
INNER JOIN HumanResources.EmployeeAddress b
ON a.EmployeeID = b.EmployeeID
INNER JOIN Person.Address c
ON b.AddressID = c.AddressID
ORDER BY a.LoginID
When that query runs, you will get some feedback on how long the query took, how many rows were returned, the ID of the process that ran the query (called the SPID), and so forth.
As you can see in Figure 5-10, there is nothing earth shattering here, but it can be useful to have simple, quick metrics on what the query does.
[View full size image] 
Execution Plans
Of more use is the ability to examine the execution plan associated with a query. An execution plan is a graphical representation of the internal path the engine takes to satisfy the query. When the plan is generated, you can examine it by hovering over each step, which provides even more information. Knowing the path gives the developer clues as to what is taking the most time, and what they can do to optimize the path. I do not spend a lot of time on the query here because we are more interested in the administration part of the system, but it is useful to show the developers they have this tool available and to look at your own queries to gauge how efficient they are.
Let's look at the path that example query takes on the Adventure-Works database. If you are still in Management Studio from the last query, close the Properties view and select Query and then Include Actual Execution Plan from the menu bar. Now run the same query again.
When the query finishes (it will take slightly longer this way), you will get a new tab in the bottom panel, called Execution Plan. Click that to see the graphical output from the query engine, as shown in Figure 5-11.
[View full size image] 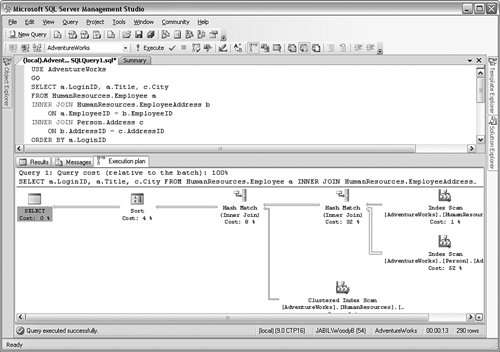
I will come back to the graphical elements and what they mean in a bit. For now, hover the cursor over each icon. You will see a large amount of text that explains metadata about that step in the query.
You can save these plans out to a file by right-clicking anywhere in the graphical area of the output. You can display saved plans in another session of Management Studio by using the File and then Open items from the menu. You can use that output in group meetings when you want to optimize performance.
Query plans are great tools for optimization, especially when the developers test the T-SQL they include in their applications. I explain a little more about execution plans in the next section.
DDL Triggers
You also have the ability to watch for data structure changes on the system. You can create DDL triggers in Management Studio that perform actions when someone attempts to change an object in the database. You can have the trigger log the action, notify you, or even prevent the change.
To show how this works, let's create a table that shows a change log on DDL operations:
USE DBAMDT
GO
CREATE TABLE dbo.Tmp_ChangeLog
     (
     DateChanged datetime NOT NULL,
     UserName varchar(55) NOT NULL,
     ChangeText varchar(255) NOT NULL
     ) ON [PRIMARY]
GO
This script creates a table with three columns: one for the date and time that the change occurred, one for the principal making the change, and another for the text message regarding the change.
Now let's create a trigger on the ServerInfo table that populates the ChangeLog values:
CREATE TRIGGER ChangeLogTracking
ON DATABASE
FOR ALTER_TABLE
AS
INSERT INTO ChangeLog
SELECT GETDATE()
, CURRENT_USER
, 'Table Changed.'
GO
We are using two system functions here, one for the current date and time (GEtdATE()) and another for the principal's name (CURRENT_USER). The last part enters the words Table Changed, so that we can see that a change has occurred.
Now let's change one of the columns in the ServerInfo table; don't worry, we won't really change it:
BEGIN TRANSACTION
ALTER TABLE ServerInfo
ALTER COLUMN LastUpdated
DROP DEFAULT
And, finally, we read from the change log to see what has been changed:
Now let's put all that back the way it was. Add this text to the end:
And now press F5 to make it all go. The BEGIN TRANSACTION and ROLLBACK statements bracket what we have done, so the change is not permanent. Here is the output on my test system:
_________________
2005-10-20 08:46:44.920 dbo Table Changed.
This script is not incredibly useful, because it allows changes and does not really tell us what has changed. You could make it more useful by adding some metadata from the EVENTDATA() function that would show the text from the change script the user tried to run. I do not spend a lot of time on that function here because it returns data in an XML format, and you will need to use a bit of XPath query functions to get the parts you want. If you are interested in learning more about that, search for "EVENTDATA()" in Books Online for more information.
You can use two scopes for DDL triggers: database and server. You need to have server-level permissions for the server scope and database-level permissions for the database scope.
Here is a table that shows the events you can trigger on for the database:
ALTER_APPLICATION_ROLE | ALTER_ASSEMBLY | ALTER_AUTHORIZATION_DATABASE
| ALTER_CERTIFICATE | ALTER_FUNCTION | ALTER_INDEX
| ALTER_MESSAGE_TYPE | ALTER_PARTITION_FUNCTION | ALTER_PARTITION_SCHEME
| ALTER_PROCEDURE | ALTER_QUEUE | ALTER_REMOTE_SERVICE_BINDING
| ALTER_ROLE | ALTER_ROUTE | ALTER_SCHEMA
| ALTER_SERVICE | ALTER_TABLE | ALTER_TRIGGER
| ALTER_USER | ALTER_XML_SCHEMA_COLLECTION | CREATE_APPLICATION_ROLE
| CREATE_ASSEMBLY | CREATE_CERTIFICATE | CREATE_CONTRACT
| CREATE_EVENT_NOTIFICATION | CREATE_FUNCTION | CREATE_INDEX
| CREATE_MESSAGE_TYPE | CREATE_PARTITION_ FUNCTION | CREATE_PARTITION_SCHEME
| CREATE_PROCEDURE | CREATE_QUEUE | CREATE_REMOTE_SERVICE_BINDING
| CREATE_ROLE | CREATE_ROUTE | CREATE_SCHEMA
| CREATE_SERVICE | CREATE_STATISTICS | CREATE_SYNONYM
| CREATE_TABLE | CREATE_TRIGGER | CREATE_TYPE
| CREATE_USER | CREATE_VIEW | CREATE_XML_SCHEMA_COLLECTION
| DENY_DATABASE | DROP_APPLICATION_ROLE | DROP_ASSEMBLY
| DROP_CERTIFICATE | DROP_CONTRACT | DROP_EVENT_NOTIFICATION
| DROP_FUNCTION | DROP_INDEX | DROP_MESSAGE_TYPE
| DROP_PARTITION_FUNCTION | DROP_PARTITION_SCHEME | DROP_PROCEDURE
| DROP_QUEUE | DROP_REMOTE_ SERVICE_BINDING | DROP_ROLE
| DROP_ROUTE | DROP_SCHEMA | DROP_SERVICE
| DROP_STATISTICS | DROP_SYNONYM | DROP_TABLE
| DROP_TRIGGER | DROP_TYPE | DROP_USER
| DROP_VIEW | DROP_XML_SCHEMA_COLLECTION | GRANT_DATABASE
| REVOKE_DATABASE | UPDATE_STATISTICS | |
And here are the server-level triggers you can create:
ALTER_AUTHORIZATION_SERVER | ALTER_DATABASE | ALTER_LOGIN
| CREATE_DATABASE | CREATE_ENDPOINT | CREATE_LOGIN
| DENY_SERVER | DROP_DATABASE | DROP_ENDPOINT
| DROP_LOGIN | GRANT_SERVER | REVOKE_SERVER
|
Using DDL triggers is a great way to control and document the changes that happen in your database.
You might be wondering about the performance impact of triggers in general, and DDL triggers in specific. There is a slight hit on the system each time a trigger is fired because it adds to the transactions that run each time. Triggers can also cause other triggers to fire, and in addition they can refer back to each other. SQL Server handles this fairly well, and you can also control the trigger flow, although this is normally something the developers are more concerned with. The short answer is that if DDL triggers are used properly, the performance impacts can be managed. DDL operations do not happen as often (if you do not count temporary tables), so as long as the trigger logic is not overly complex, performance impacts are normally low.
System Views and Functions
SQL Server 2005 tracks an amazing amount of information about itself. The data it collects is accessed through system functions, stored procedures, dynamic views, and catalog views. These are the objects that you will use most often to show the activity within your system.
In previous versions of SQL Server, several system databases stored a great deal of metadata. These have been replaced by objects owned by the sys schema. Most of the older tables are reproduced in this schema, and new views have been added. Here is a script that shows you all of these objects:
SELECT name
FROM sys.all_objects
WHERE schema_id =
(
SELECT schema_id
FROM sys.schemas
WHERE name = 'sys'
)
ORDER
| 


