Monitoring and Performance Tuning
Monitoring SSIS is different from monitoring other SQL Server activities because it involves a mix of what Microsoft provides and what you create. In addition, you might need to monitor parts of the source and destination systems to find any bottlenecks. System MonitoringYou can use several Windows System Monitor objects and counters to monitor SSIS. The object you want to monitor is SQL Server:SSISPipeline. You can add the following counters to the System Monitor logs you create for your other monitoring.
Package LoggingYou should monitor the system using Windows System Monitor, but if you are looking for bottlenecks or problems, you will only get part of the picture with that tool. Because SSIS is a development tool, you will be responsible for creating your own logging. You can go a bit overboard with logging if you are not careful. In complex systems, especially ones deployed to other servers, it is a worthwhile effort to use variables to set whether the system create more logs or fewer. That way, you can turn the logging on when you are looking for a problem and turn it off when you are in production. Here are the logging providers you can use.
To create logging for the package from the preceding section, open the project you saved earlier and click SSIS from the menu bar, as shown in Figure 8-31. Figure 8-31.[View full size image] 
Once inside, you must choose the type of log provider you want to work with. I am going to set this example to send the output to the Windows event logs because that is how I normally check the condition of my servers. I can then use filters to display the events I am interested in. I click the Add button to send this selection for the log locations. You can select as many logs as you like, but there is a slight impact to performance if you go overboard with the logging. You can see my selections in Figure 8-32. Figure 8-32.[View full size image] 
Next I drill down to the tasks in this package. In Figure 8-33, I select both tasks and all their events. This is for demo only; do not select everything blindly in production. Only log what you need to know about on a consistent basis. Figure 8-33.[View full size image] 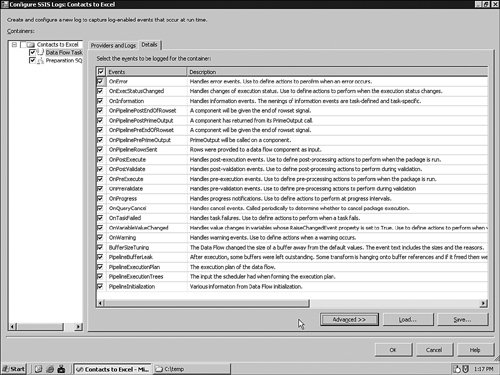
With the selections in place, I switch tabs to Providers and Logs and select the Windows event log provider I created a moment ago. You can create a different provider for each task if you want. You can see the results in Figure 8-34. Figure 8-34.[View full size image] 
I click OK to close this panel and then run the package by pressing F5.
If your run fails, ensure that you have deleted the Excel file before you try it again. When the process completes, I open the Application Log in the Windows Event Viewer and check for the SQLISPackage source. In this panel, I can see just how many rows were written in this operation. Figure 8-35 shows the event on my test system. Figure 8-35.[View full size image] 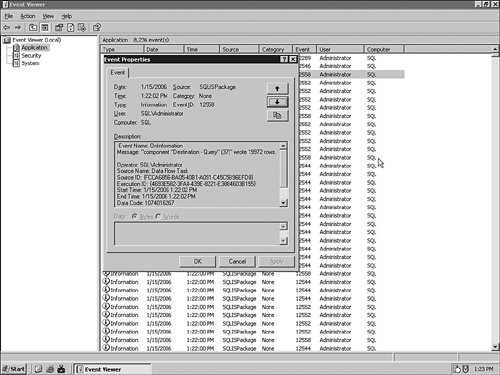
Performance TuningThere really is not any magic to performance tuning: It is a combination of proper system sizing and configuration, asking only for the data you need, and optimizing the logic in your code. It is no different here than in any other application. Good performance begins with the system's sizing and configuration that I explained in Chapter 1, "Installation and Configuration." You need to have adequate memory and a fast I/O system in combination with an efficient network connection and adequate processors for the system where the packages run. Because your source and destination data may be located on another system, the network component deserves more scrutiny. The fastest, most efficient system will not help the overall speed of the system if the network connection is the bottleneck. Although you might not have the ability to add network capacity, your data flow plan should include a timing component so that you can send less data more often. You should also work hard to ensure that you do not get data you do not need. In the example project I just created, the suffix is sent even though it is not needed. A better design is to send only the fields that are required from the source and create the derived columns on the destination. The last component is to ensure that your logic on any transformations is as optimized as possible. There is no substitute for a peer review in this situation. Although it is sometimes painful to have others review your process, it is one of the only ways to ensure that you have explored all possible ways to implement the logic. Whether you are the expert in the office or the junior member on staff, it is still valuable to review your code. You can take some concrete acts to optimize the system for the SSIS process. Ensure that all the tables you read from have as many covering indexes as the system can tolerate. Quick queries make quick sources. Ensure the destination tables have as few indexes as possible, or suspend them if you can. This is not always possible, but if you can it will save the updates on the indexes while the import is running. If possible, use stored procedures when you are calling for data from SQL Server systems. Stored procedures can be compiled into the memory space on the server more efficiently than dynamic SQL statements. I want to mention one final note on performance tuning for SSIS. In many situations, you can scale up solutions by using 64-bit processors. Although SSIS runs on 64-bit processors, the Itanium version does not include the Business Intelligence Development Studio, and it will not install on that platform. That is not normally an issue because it is more efficient to design projects on a workstation expressly used for that purpose, but it is something to keep in mind. The other issue with the 64-bit processors is to make sure that you select the proper providers for the platform. If you are not careful, you can find yourself using 32-bit providers on a 64-bit platform and thus negating the performance gains you thought you might get. Check the topic "Integration Services Considerations on 64-bit Computers" in Books Online for more information. |


