The SQL Debugger
One of the most significant features in Query Analyzer is the SQL Debugger. With the various commands and programming constructs in Transact-SQL (T-SQL), stored procedures can perform some pretty complex operations. You might have as much programming logic built into stored procedures as in some of your other application routines written in other programming languages. As you develop and test your application code written in Visual C++ or Visual Basic (or whatever programming language you might be using), it is likely that you will use a debugger to step through the code and verify that it is working correctly or to identify where the logic is breaking. When your stored procedures are not executing correctly or they are returning the wrong result, you need to debug them as well.
In the old days, the only way to debug stored procedures and step through them line by line was to rewrite them as SQL batches and execute the statements individually or in small groups. The problem with this approach was that the contents of local variables didn't carry over between batches, so you had to redeclare and reinitialize the variables for each batch and set the values to what they were at the end of the previous batch. This process was tedious, and the SQL statements would optimize differently when passed a variable rather than what would have been a stored procedure parameter. For more information on how queries are optimized, see Chapter 35, "Understanding Query Optimization."
The only other way to track what a stored procedure was doing was to litter it with print statements to display the status of the procedure and the contents of local variables and parameters at various points. I remember using this approach one time to debug what looked like a simple problem. I had a stored procedure that needed to delete a parent record, and then all related child records. Everything worked just fine by using local variables and separating each SQL statement. My print/debug statements didn't shed any light on the matter, either.
After spending about half a day trying to track it down, I finally identified the problem?I was missing a parameter to the stored procedure that was being called within the main procedure, shifting the parameter values over one and causing the wrong value to be used to find the matching rows. (I could have avoided this by passing the parameters by name rather than position. Live and learn!) If only I had had a debugger available to debug the stored procedure, I could have identified the problem in a minute instead of a day.
The First T-SQL Debugger
Stored procedure debugging was available for SQL Server prior to SQL Server 2000, but it wasn't part of the SQL Server installation. Since the release of Visual Studio 6, Visual Interdev has included a T-SQL Debugger. Prior to this, it was available inside Visual Basic Enterprise 5.0 and Visual C++ Enterprise 4.2.
However, getting the debugger up and running was an arduous process. You had to have all the following pieces in place:
You had to have the Enterprise Edition of Visual Studio installed.
You had to be running at least SQL Server 6.5 with Service Pack 2 or later.
The server running SQL Server had to be running under Microsoft Windows NT 4.0 or later.
The client workstation had to be running Windows 95 or Windows NT 4.0 or later.
In addition, for SQL Server versions prior to SQL Server 2000, the debugging components were not installed on the server by default. To get the debugger to work, these pieces had to be installed manually. This caused a lot of headaches: Programmers who wanted to use stored procedure debugging had to bother the administrator, who might or might not have seen the need to install these pieces. It's a rare administrator who will upset the delicate balance of his smoothly running SQL Server to indulge the whim of a developer, unless some sort of bribe is involved.
You also needed to ensure Distributed COM (DCOM) was installed properly on the server and the client. You had to make sure the DCOM configuration on a Windows 98/Me machine supported debugging.
The main problem with using this debugger was that you had to install Visual Interdev. This was a pretty large, involved install if all you wanted to do was use a SQL Debugger. Also, the debugger was not part of a standard query tool like Query Analyzer, nor was it a standalone tool. It had to be brought up via a Data View window in Visual Studio.
People needed a T-SQL Debugger that could be installed along with the SQL Server Client Tools that was integrated with Query Analyzer. That finally came along in SQL Server 2000.
Using the T-SQL Debugger in Query Analyzer
Query Analyzer that ships with SQL Server 2000 now includes an integrated T-SQL Debugger. This is a full-featured debugger that lets you step through stored procedure code a line at a time, set breakpoints, view the contents of local and global variables, and see the results of the T-SQL statements as they execute.
TIPThe 2000 client brings a modern debugger to the SQL Server development environment. However, you do not necessarily need to have SQL 2000 to debug procedures. You can use a version 7 server. Instructions for making this work are available on the Microsoft support Web site at http://support.microsoft.com/. |
The necessary steps for invoking the debugger are not easily apparent. To debug a stored procedure from within Query Analyzer, follow these steps:
-
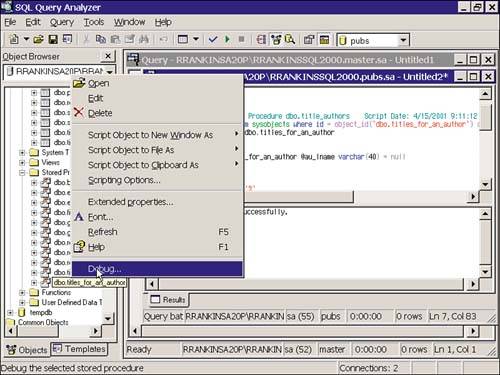
Open the Object Browser, if it is not already open, by pressing F8.
-
Drill through the tree to the stored procedure you want to debug.
-
Right-click on the procedure and select Debug from the context menu (see Figure 6.14).
Figure 6.14. Invoking the SQL Debugger from the Object Browser.
At this stage, a couple of common problems could prevent full use of the debugger. These problems are discussed in the next section.
CAUTIONSQL debugging makes use of Distributed COM calls, which can have adverse effects on the stability and performance of your SQL Server machine. Although the debugger is a useful tool in a development environment, you should never consider using it in your production environment. |
Debugging a Stored Procedure
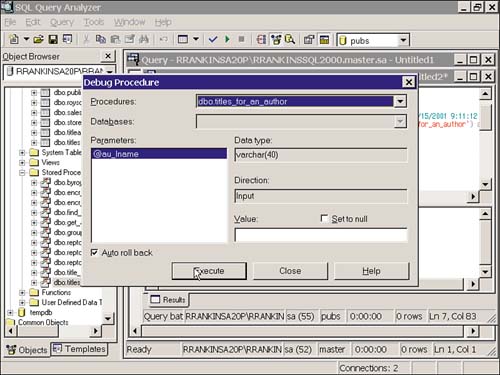
If everything is properly configured when you invoke the SQL Debugger, you will first be presented with a dialog where you can enter values for the procedure parameter(s), if any (see Figure 6.15). Click the Set to Null check box if you want to specify a NULL value for a parameter. There is also a check box that lets you specify whether you want the procedure to automatically roll back or not. Auto Rollback is the default option. This feature allows you to test and debug a stored procedure that modifies data without the data changes being permanent, so you can repeatedly debug the procedure with the same datasets each time. The debugger initiates a BEGIN TRAN statement before executing the procedure, and automatically issues a ROLLBACK TRAN when debugging is stopped. If you want to commit the changes made to data while debugging the stored procedure, uncheck the Auto Rollback option.
Figure 6.15. Providing input parameter values to the SQL Debugger in Query Analyzer.
CAUTIONBe careful when debugging stored procedures that modify data on systems where other users or processes are executing queries. Any locks acquired during a debugging session will be held until the debugging is stopped and the changes are rolled back. This can block other users from accessing data and adversely impact system performance. For this reason, stored procedure debugging should only be performed in test or development environments where performance is not an issue. |
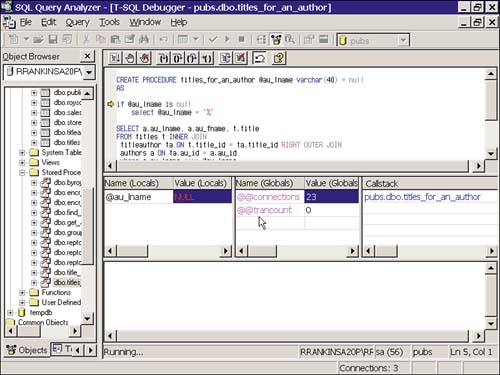
Once you have provided any necessary input parameters and clicked the Execute button, you will next see the SQL-Debugger interface with a yellow arrow pointing to the first line in the stored procedure (see Figure 6.16). At this point, you can step through the stored procedure one line at a time, or you can set breakpoints and run to the breakpoints. All operations in the SQL Debugger are controlled by selecting the buttons on the Debugger toolbar, by right-clicking in the debugger window to bring up the command menu, or by using the keyboard shortcuts for the Debugger commands. Table 6.1 describes the available commands in the Debugger and the corresponding keyboard shortcuts.
Figure 6.16. The SQL Debugger interface.
| Command | Description | Keyboard Shortcut |
|---|---|---|
| Go | Runs the stored procedure in debugging mode to the next breakpoint or to the end of the procedure. | F5 |
| Toggle Breakpoint | Sets or removes a breakpoint at the current line. Break-points cannot be set on blank lines or lines containing nonexecutable code such as comments or declaration statements. | F9 |
| Remove All Breakpoints | Clears all breakpoints that have been set in the current debugging session. | Ctrl+Shift+F9 |
| Step Into | Executes the statement at the current execution point. If the statement is a call to a procedure or statement that contains a user-defined function or fires a trigger, the de-bugger positions itself on the first statement in the procedure, function, or trigger. | F11 |
| Step Over | Executes the statement at the current execution point, but if the current statement is a call to a procedure or statement that contains a user-defined function or fires a trigger, Step Over executes the statement or procedure as a unit, and then positions the debugger at the next statement in the current procedure. | F10 |
| Step Out | If the debugger has stepped into a procedure, user-defined function, or trigger, this command completes execution of the procedure, function, or trigger and positions the debugger at the next statement in the calling procedure. | Shift+F11 |
| Run to Cursor | Executes all statements from the current execution point up to the position where the cursor is placed. | Ctrl+F10 |
| Restart | Aborts the current debugging session and restarts exe-cution from the beginning of the stored procedure. | Ctrl+Shift+F5 |
| Stop Debugging | Aborts the current debugging session. | Shift+F5 |
| Auto Rollback | Toggles the Auto-Rollback option on or off. |
The Debugger Window Panes
The SQL Debugger window consists of five window panes. The top pane is the Source Code window pane that displays the text of the procedure, user-defined function, or trigger that is currently being debugged. This window pane indicates the current execution point and is where you can set and display breakpoints.
NOTEIf you modify the code for the top-level stored procedure that is currently displayed in the debugger window, you will need to stop and close the debugging session and restart it to pick up and display the changes in the debugger window. |
The three middle window panes are the Local Variables window pane, the Global Functions window pane, and the Callstack window pane. The Local Variables pane displays the name, value, and type of each input and output parameter and any local variables defined within the current procedure scope. You cannot add or remove any of the variables listed in this pane, but you can change the values assigned to the variables. This is useful for evaluating and testing different variable values and their impact on program flow and execution.
The Global Functions pane displays the values currently returned by the Global Functions based upon the current state of execution. You cannot modify the values for the global functions, but you can add additional global functions to the list to monitor different values, such as @@ROWCOUNT, @@IDENTITY, @@ERROR, or @@NESTLEVEL. For more information on the available global functions, see Chapter 26, "Using Transact-SQL in SQL Server 2000."
The Callstack window pane shows the list of currently open procedure calls, with the top procedure being the currently active procedure. (The currently active procedure is the one that determines the scope of the values displayed in the Local Variable and Global Function window panes.) You can change the values displayed in these panes and the Source Code window pane by clicking on the other procedures listed below the top procedure in the Callstack pane. The Callstack pane is useful to keep track of the nesting levels of the currently executing procedures.
The bottom window pane is the Results Text window pane. This window pane displays any results generated by the stored procedure being debugged as well as any print or error messages generated.
The Status Bar
The status bar at the bottom of the main Debugger window displays the current state of execution (Running, Completed, or Aborted), the name of the SQL Server the debugger is currently connected to and the login ID used to connect, the current database context, and the line number and column where the cursor is currently positioned within the Source Code window.
Debugging Triggers and User Functions
Triggers are fired only when a data modification statement runs against the table on which the trigger is defined. It isn't possible to directly invoke or debug a trigger, but you can debug triggers and user-defined functions if they are invoked from within a stored procedure you are debugging. To step into and debug a function or trigger, use the Step Into debugger option when invoking a command that includes a function or performs a modification on a table for which a trigger has been defined. Once the debugger is in the user-defined function or trigger, you can debug it just like debugging stored procedures, including setting break points, stepping into other user-defined functions or stored procedures, or aborting or restarting the debugging session.
If no stored procedure exists that invokes the user-defined function or trigger you want to debug, you will need to write a simple test procedure that executes a SQL statement you can step into that invokes the user-defined function or trigger you wish to debug.
Limits of the Debugger
The debugger provides a pleasing interface for monitoring local procedure variables and global variables (@@trancount, for example) at each stage of execution. However, the debugger has the following limits:
Some data types cannot be monitored in the watch windows, including table datatypes, cursor variables, sql_variant (if the passed variable is a restricted type), and any BLOB types (image, text).
Stored procedures larger than 64K cannot be debugged. If you need to debug procedures this large (and with so much code, it's likely you will), consider breaking up the procedure into several child procedures. The debugger can step into child procedures.
SQL Server limits are in effect. The callstack cannot exceed 32. SQL Server 2000 limits the maximum nesting level of stored procedures to 32. The maximum number of parameters that can be passed to a procedure is 2,100.
Common Debugger Problems
The most common problem with the debugger is attempting to run the server under the local System account. If you are running the server locally on your development box, and don't expect to need to interact with network services, it is fairly common (although not recommended) to configure a server to use the local system account.
Regardless of whether the server is running locally, if the server is using the local system account and you are running a Windows 2000 or Windows NT client, you will see the following message box when you run the debugger:
|
SP Debugging may not work properly if you log on as 'Local System account' while SQL Server is configured to run as a service. You can open Event Viewer to see details. Do you wish to continue? |
NOTEIf you are running Query Analyzer from Windows 95, 98, or Me, you will not receive this helpful warning message, but the undesirable behavior will be the same. |
If you continue, the debugger will load, but you will not be able to set breakpoints or step through the procedure. If you look in the system application log using Event Viewer, you will see this error message logged, from source SQLDebugging98:
|
SQL Server when started as service must not log on as System Account. Reset to logon as user account using Control Panel. |
To resolve this, change the logon account. In an enterprise setting, it is most appropriate to use a system account that restricts interactive logins, and that has been set up specifically for use by the SQL Server service. You will want to do this to take advantage of replication and multiserver administration features in any event, so take this chance to set up a separate domain account.
It is also possible to use the local Administrator account to get the debugger working. If you normally log on to your machine with an account that is different from the one under which the SQL Server service runs, you will also need to follow the instructions in the "DCOM Configuration" section later in this chapter.
Changing the Server's Logon Account
From Windows 2000, on the machine running SQL Server, follow these steps to change the logon account to local Administrator:
From the desktop, right-click on My Computer and select Manage from the context menu.
In the Computer Management tree, open Services and Applications and select Services.
A list of services appears on the right. Open the MSSQLSERVER service by double-clicking it or selecting the Properties of the service.
A service dialog box opens. Select the Log On tab.
The window will display a choice of Local System Account or This Account. Select the This Account option. Type in the Administrator logon and the local machine's admin password.
Restart the MS SQL Server service. (Remember to also restart SQL Agent if you have scheduled jobs on this server.)
Reconnect to the server from Query Analyzer. You should be able to use all features of the debugger.
CAUTIONThere is an active bug in SQL 2000 debugging that can cause an access violation. If your server kills your connection or crashes when debugging, ensure that the server has a name. Run this query to see if your server has a name: select @@servername If the query returns NULL, run this query to give your server a name, and restart the SQL Server service: exec sp_addserver 'MyServerName', 'local' |
DCOM Configuration
Under Windows 2000, you can examine the distributed COM configuration by running DCOMCNFG.EXE. If you plan to debug stored procedures using logon accounts different from the one used by SQL Server, you will need to follow these directions on the SQL Server computer:
-
Run DCOMCNFG.EXE, normally found in \winnt\system32.
-
In the Distributed COM Configuration Properties window, select the Default Security tab. Under Default Access Permissions, click Edit Default.
-
Add the group Everyone by selecting it and clicking Add, OK.
-
Restart the SQL Server service.
Windows 98/Me might have DCOMCNFG.EXE in the \windows\system directory, but some installations do not. The most reliable way to enable DCOM on these systems is to follow these steps:
-
Run REGEDIT.EXE to open the registry editor.
-
Expand HKEY_LOCAL_MACHINE\SOFTWARE\Microsoft\Windows\CurrentVersion\Run.
-
Add a new string value named RPCSS. Set the new string's value to the path to RPCSS.EXE, normally found in C:\Windows\System\RPCSS.EXE.
-
Set the value of HKEY_LOCAL_MACHINE\SOFTWARE\Microsoft\Ole\EnableDCOM to 'y'.
-
Set the value of HKEY_LOCAL_MACHINE\SOFTWARE\Microsoft\Ole\EnableRemoteConnect to 'y'.
-
Restart the computer.


