About Word's Business Diagrams Capabilities
In addition to organization charts, Word can instantly build five more key types of business charts:
Cycle diagrams are commonly used to explain continuous processes. Figure 15.31 shows a cycle diagram for a software development project. This project starts with planning, but after software has eventually been delivered, it cycles back into planning for new enhancements.
Figure 15.31. A cycle diagram for a software development project.
Radial diagrams (as in Figure 15.32) are commonly used to describe processes that all center on, or radiate from, a single core element.
Figure 15.32. A simple radial diagram.
Pyramid diagrams are commonly used to explain how elements of a project or process build on each other. Figure 15.33 shows a pyramid diagram showing how computers are organized conceptually.
Figure 15.33. A simple pyramid diagram.
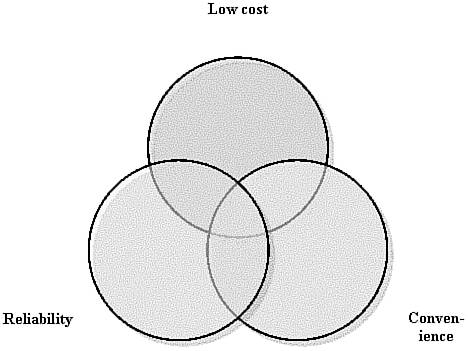
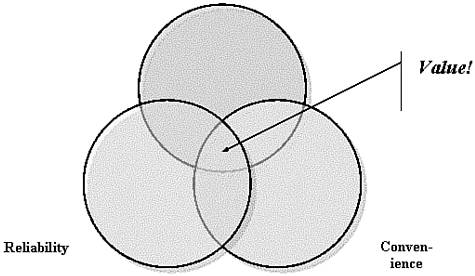
Venn diagrams are commonly used to explain aspects or characteristics of a system that are different and point out aspects or characteristics that overlap. Figure 15.34 shows a simple Venn diagram.
Figure 15.34. A simple Venn diagram.
TIP
For more Venn diagram applications than you ever imagined possible, visit www.venndiagram.com, where Thomas Leonard has already compiled nearly 800 real-world Venn diagrams.
Target diagrams are commonly used to present steps toward a goal, as shown in Figure 15.35.
Figure 15.35. A simple target diagram.
To create any of these charts, choose Insert, Diagram, or display the Drawing toolbar (by choosing View, Toolbars, Drawing); then click the Insert Diagram or Organization Chart button. The Diagram Gallery dialog box opens (see Figure 15.36).
Figure 15.36. The Diagram Gallery dialog box.
Choose the type of diagram you want to create and click OK; Word inserts a generic diagram within a drawing canvas. Word also displays the Diagram toolbar, which contains Word's features for formatting and managing diagrams. Table 15.4 presents the tools available on the Diagram toolbar.
Button | Function |
|---|---|
| Inserts additional shapes into your diagram, such as a new 3D circle that surrounds the 3D circles already present in a target diagram. |
| Moves all the diagram's shapes (and their text contents) one element backward. For example, in a cycle chart, moves every element counterclockwise. |
| Moves all the diagram's shapes (and their text contents) one element forward. For example, in a cycle chart, moves every element clockwise. |
| Reverses the locations of all text elements in the diagram. |
| Controls the size and scale of the diagram and drawing canvas. |
| Displays Autoformat options for reformatting diagrams. |
| Changes one type of diagram to another. |
| Displays options for wrapping text around or through organization charts. |
Many of the tools Word provides for working with diagrams are similar to those you learned about in the discussion of organization charts, earlier in this chapter.
For example, each type of diagram has its own Diagram Gallery with AutoFormat designs you can use to change the look and feel of your diagrams, and the designs Microsoft has provided for each type of diagram are consistent with those it has provided for organization charts. By consistently using the design with the same name, you can have consistent, attractively formatted diagrams and organization charts throughout your documents.
Similarly, you can use the tools on the Layout button to shrink your drawing canvas around the edges of your diagram (Fit Diagram to Contents); to slightly enlarge the diagram (Expand Diagram); or to display sizing handles for the entire drawing canvas (Scale Diagram).
A few tools, however, are unique to the Diagram toolbar. For example, if you decide partway through working on a diagram that your message would be communicated more effectively with a different type of diagram, you can click the Change To button and choose from any of the other four types of diagrams.
You can also move information between elements of your diagrams with a single click. For example, imagine that after you create a pyramid diagram, you realize that the text in the second and third shapes on the pyramid should be switched. Select the third shape and click the Move Shape Backwards button. Word switches the third item with the one above it.
NOTE
The Move Shape Backwards and Move Shape Forwards buttons on the Diagram toolbar look different depending on the type of diagram you are working with, but they are always located in the same position and perform the same tasks.
Occasionally, you may want to "turn a diagram upside down": reverse the location of all the contents in your diagram. For example, in a pyramid diagram, you might want to move the text that appears in the wide foundation layer all the way to the point at the top, while reversing the order of all the other layers as well. To do so, click the Reverse Diagram button.
A Note on Formatting Diagrams
Word offers only limited control over formatting of business diagrams. As you've seen, you can click AutoFormat to choose a new format for the entire diagram. You can also format the text in each text box. For example, you can center the text in an individual text box instead of left-aligning it, you can change its font, and you can use borders and shading.
However, you cannot move or resize a text box or shape within a diagram. For example, if you want to enlarge the circle at the center of a radial diagram, Word's diagram feature provides no way to do it.
If you want to reformat a text box, you can right-click to select it and choose Format AutoShape?but after you do, you'll find that most controls are unavailable. You can only set internal margins and define alternative text that appears in place of the diagram when viewed by Web browsers without graphics.
Occasionally, you may find these limitations extremely frustrating. There are two possible workarounds, neither of them ideal.
You can create and polish your diagram using Word's tools and then superimpose additional shapes or elements over the diagram using Word's drawing tools (see Figure 15.37). For example, as in the previous example, if you want to place a larger circle in the middle of a radial diagram, you can create that circle using the Oval tool on the Drawing toolbar (press Ctrl to get a perfect circle). You can then drag the circle to the appropriate location; right-click on it and choose Add Text to enter text in it. You can then format it as you want. The disadvantage: Diagrams become more complicated to manage, especially if others must update them. Also, some of Word's diagram shapes are difficult to replicate with Word's drawing tools.
Figure 15.37. Using a callout from the Drawing toolbar to display text in the intersection of a Venn diagram.
TIP
Don't hesitate to use Word's drawing tools along with a diagram when it makes sense. For example, Word's diagram tools provide no way to enter text in the intersecting area of a Venn diagram, but as Figure 15.37 shows, you can do it easily with a callout.
If you still have access to a computer running Word 97 or Word 2000, you can open the file containing the diagram in one of these versions of Word, right-click inside the diagram, and choose Ungroup from the shortcut menu. You can then edit each individual element of your drawing, as if you had created them with Word's drawing tools. The disadvantage: When you reopen the document in Word 2003, Word no longer recognizes it as a diagram?if you have more changes to make, you must continue to make them manually, using Word's drawing tools. Also, of course, many individuals and businesses no longer have access to copies of Word 97 or 2000.


